Server and OS - Understanding CPU Usage
Beginning with build B1941, the vsmStudio uses the concurrency runtime subsystem. This brings a row of changes to the system which enables the vsmStudio to efficiently use and distribute the internal tasks across more CPU cores. Above all, that means that these tasks can be executed faster and that e.g. more ports can be handled within the same time. This gives us the necessary headroom to implement future features.
As a side effect the CPU load has changed and many are confused about this side effect. This document intends to clarify some of the confusion.
In order to understand the implications of the following, please always remember that the vsmStudio basically owns the CPUs. All the CPUs and cores in the vsmStudio’s server only exist to support the vsmStudio and its performance needs in order to process and perform the user requests as fast as possible and to communicate these to the attached devices. Without this dedication the vsmStudio would not be able to perform in semi real-time.
While the vsmStudio has always performed operations in parallel, especially in regards to I/O, some of the other operations have been on a dedicated thread base. Simplified stated one core performed execution of e.g. user request, while another handles e.g. protocol timers and then another core handles e.g. GPI logic – again simplified spoken. In particular the protocol timers were a bottle neck, because as installation sizes increased, even if each protocol instance only required a fraction of a millisecond they would add up. If for example, every protocol instance required 1ms to execute, in a system with 500 ports it would take a theoretical 500ms to serve all protocols, which simply would be far too long.
This is where concurrency comes in…
On the following pages we will be visualizing the changes using a simplified model, where we have customers, e.g. at a Bank, representing the tasks and the clerks representing the executing threads or CPU cores:

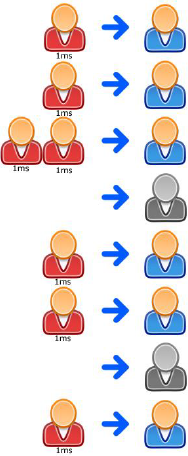
So focusing on the protocol timers and ignoring the other tasks vsmStudio performs, the situation before concurrency can be represented as following:

We see here 8 tasks, which will each take the clerk 1ms to process, waiting for one core (clerk) to handle them, while 7 other cores (on an assumed 8 core server) are “sleeping”. For a process on a computer “sleeping” means that the core is not doing anything for this process or application, but is either handling some other application or some system task. Assuming that our “clerk” is working at its maximum, the system would show that our process is using 1/8 or 12% of the systems CPU time, and the queue of 8 tasks would be completely processed after 8ms.
The next logical step is to use parallel processing which is a predecessor of concurrency.
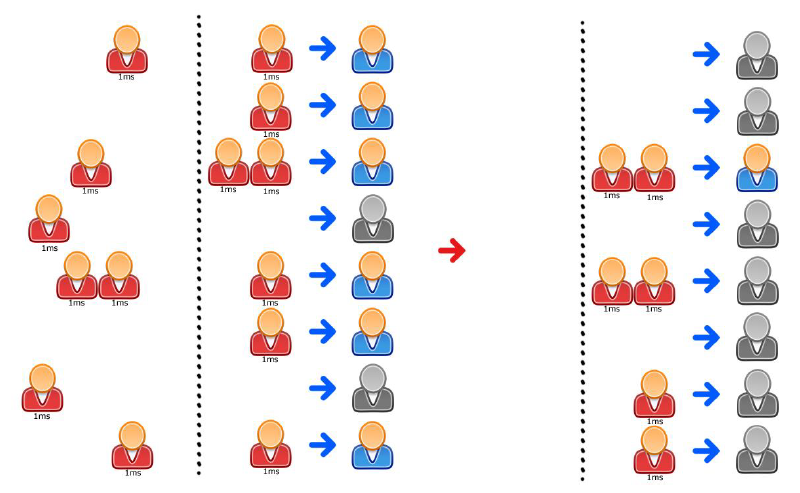
When traditional parallel processing is used the above situation is now different:

Here we see that the 8 tasks have distributed themselves across multiple clerks. If we were looking at the CPU load in this moment it would show us 6/8 or 72%.
The most important thing visible here is that everything only took 2ms in total. Which is the desired effect.
When the individual queues are empty we have to yield the cores back to the operating system or else the system will take them back, which results in a performance penalty.
But now we have a problem, if we yield the cores which are idle to the system, we do not get them back before the system is ready to hand them back. A reallife analogy might be the clerk going away to do some back-office job or a coffee break every time his queue is empty. Which means that the customer would have to wait either in another queue or at an empty desk. Also we have to assume that the clerk is unable to see beyond his queue. He cannot see upcoming work and therefore these might end up waiting at an empty desk:

In this simple example the impact seems not great, but not only do the tasks that have an active core take 2ms instead of a theoretic 1ms, we also have no idea when the system will give us the cores back to execute the remaining tasks.
Apart from the above problem, getting and releasing a core is a costly process in itself. The management overhead in the operation system can easily add up to be magnitudes more than the actual execution time of the task.
To avoid this situation the concurrency runtime uses a simple “trick”.
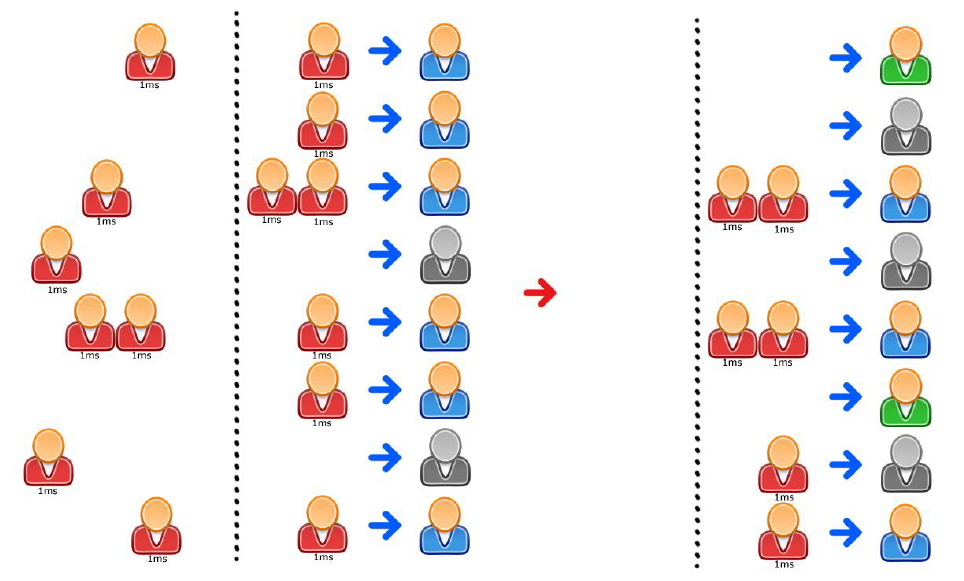
It simply tells the clerks that they cannot leave before a certain time has passed. That means that they are ready to serve any slightly delayed customer instantaneously:

This leaves us with a lot smaller chance of having to wait for a core that is busy handling a different application. The downside is, that our process is reported to be using 5/8 or 60% CPU load, even though not every core is doing something productive.
In the case of the vsmStudio, depending on the amount of ports, there is always something to do. Therefore there might be a lot of threads that briefly execute a task, return to waiting state and then already have something new to do. On systems that have less ports than cores (e.g. the personal test laptop) the CPU load will be very low, while on systems with many ports the system appears to have a high CPU load. As matter of fact the way this is handled still allows other application to run fast, because the concurrency runtime will detect busy cores and distribute the workload onto the cores that current have been allocated to the vsmStudio process.
Also, due to operating system constraints, there is an over commitment of threads on systems with 16 or less cores. This will result in slightly higher readings when there is a high I/O throughput. On systems with more than 16 cores the CPU load will seem significant lower.
Additionally, the windows task manager actually does not and cannot display the real CPU usage, but only the usage at the given interval, the task manager cannot see nor visualize the small interruptions when an application does hand back the CPU to the system. This is a known problem in windows and can lead to false high readings and occasionally, but not quite as frequent, false low readings. The Task Manager is good for judging applications where one or more threads are permanently using CPU time, but very inaccurate for application where the load is constantly changing and distributed across many cores.
Additionally, the overall load might differ from build to build, as the system evolves and more tasks get shifted into concurrency. Also, the load balancing algorithms in the concurrency runtime can change depending on load, cores, CPUs or the version of the actual runtime.
As this all makes it difficult to judge if something is wrong and how much CPU time actually is used, the vsmStudio has the “Status Information Window” which can be opened in the “Window” menu:

The most important value here is the “Timer Total”. This value will generally stay under 10ms and might peek at the odd occasion.