Power Core RP v2 - RAVENNA Menu
In the RAVENNA menu, there are seven pages/tabs. They can be used to check and troubleshoot the Audio-over-IP streams. Most of the information is for diagnostic purposes only. Values which can be modified are noted for each tab.
RAVENNA → Global
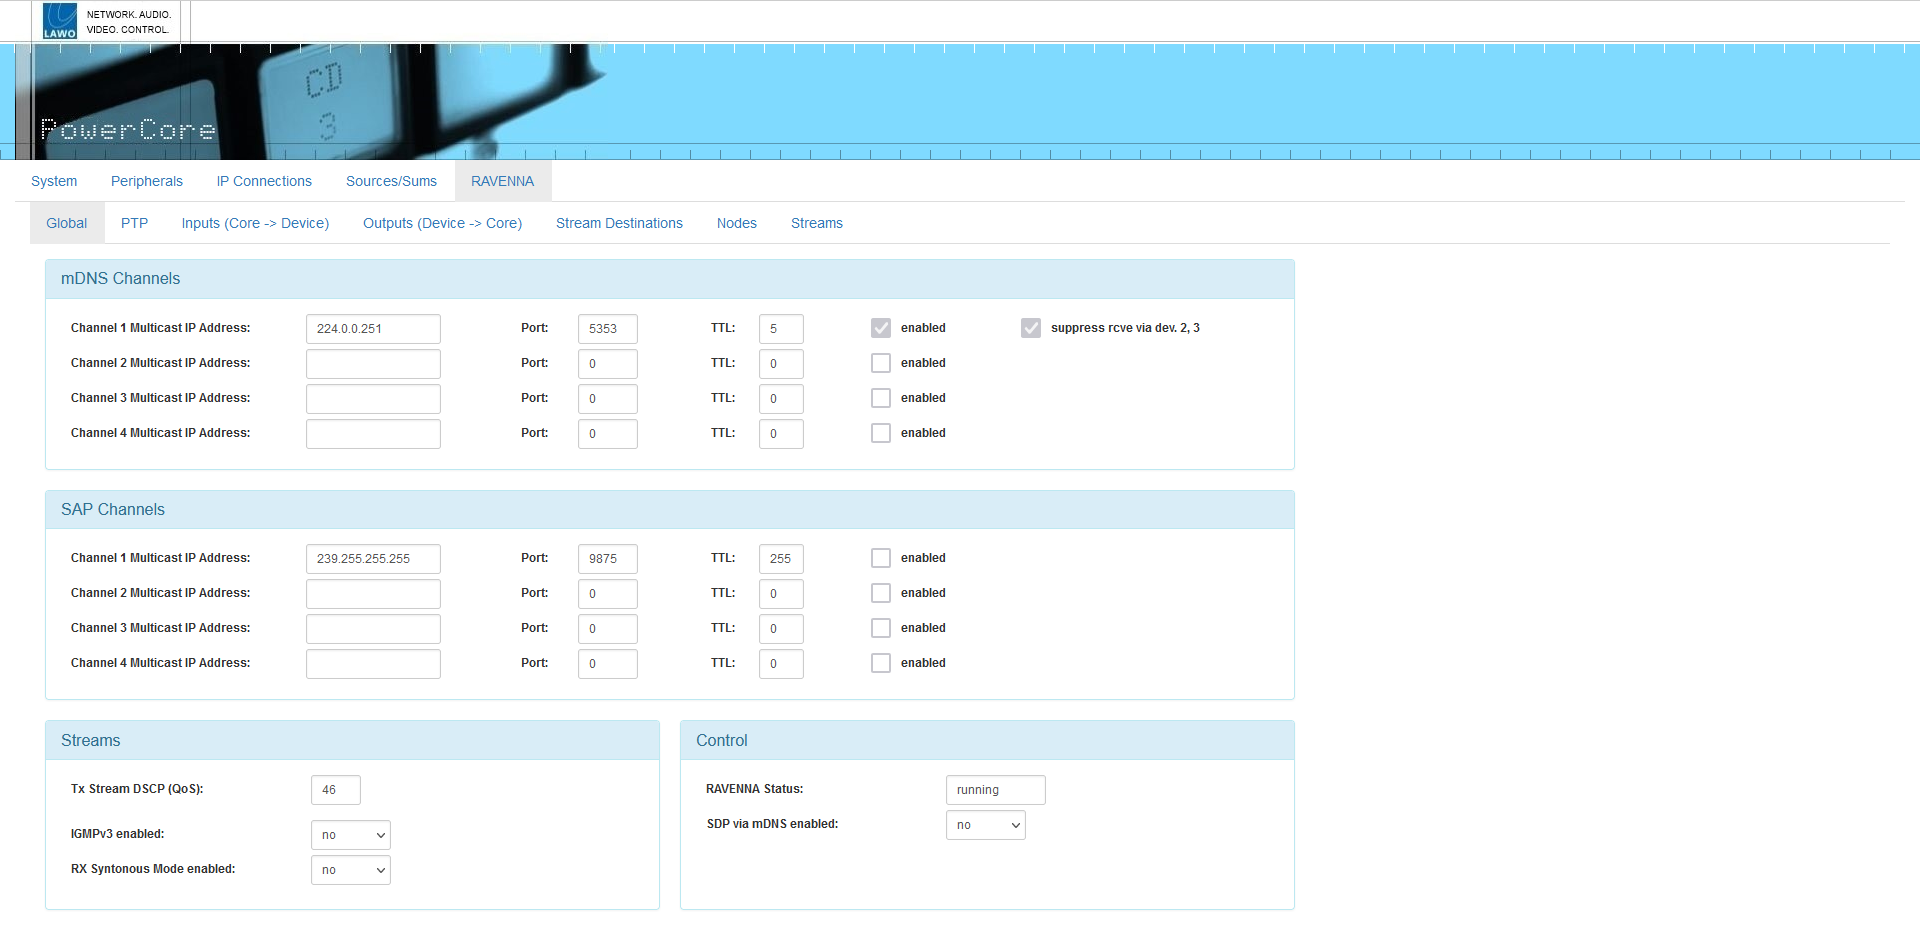
The RAVENNA → Global tab displays Power Core's global RAVENNA settings. The parameters are configured by the ON-AIR Designer; there are no editable fields.
mDNS & SAP Channels
The first two areas define the mDNS and SAP channels used for stream announcement:
- mDNS Channels use the multicast Domain Name System defined in IETF RFC 6762.
- SAP Channels use the Session Announcement Protocol defined in IETC RFC 2974.
For each channel, you will see the "Multicast IP Address", "Port" number and "TTL" value (in seconds). The "enabled" checkbox shows if the channel is enabled or disabled.
Streams
This area shows the global options for streams.
Control
Here you will see the status of the RAVENNA service and the global options for control.
RAVENNA → PTP
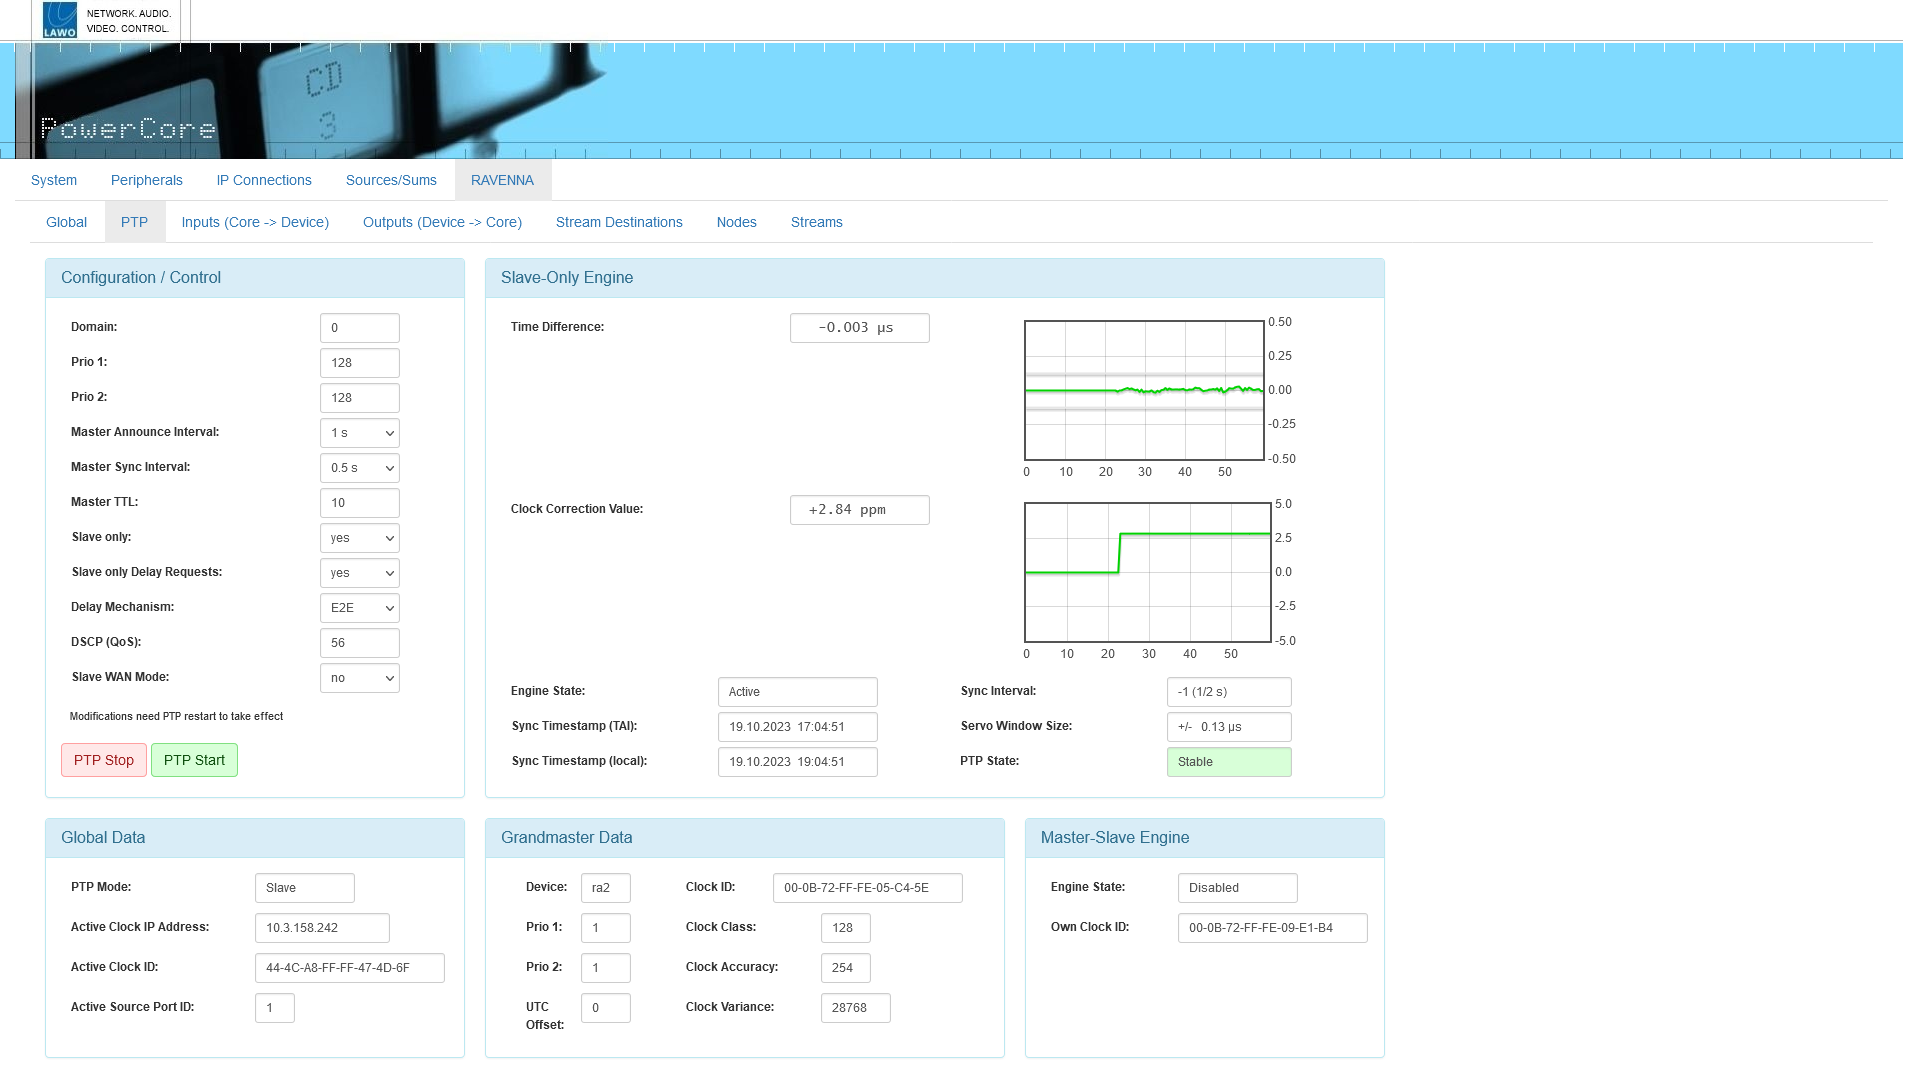
The RAVENNA → PTP tab shows statistics and options for the system's PTP clocking.
For convenience, you may enter new temporary PTP settings (as described below). However, to make permanent changes, it is recommended to edit the values defined in the configuration (using the ON-AIR Designer). This ensures that the changes remain in place after a cold start.
Configuration / Control
This area defines the PTP mode and its associated parameters. Power Core supports two possible PTP modes: slave only and master-slave. If Slave only is enabled, then Power Core is forced to operate as a PTP slave at all times. If Slave only is disabled, then Power Core will operate in PTP master-slave mode, whereby the PTP priorities set within the device itself and all other streaming nodes determine the current PTP master.
To make a temporary change, either choose a different option from the drop-down menus or type in a new value into the permitted fields. Any changes require a PTP restart to take effect, so press PTP Stop and then PTP Start. Any changes will remain in place until the next cold start.
Slave-Only Engine
The two graphs in this area monitor PTP jitter across the system. This is useful for system analysis and debugging. As a rule of thumb, the "Clock Connection Value" display should be stable with little variance over time as an indication of good system health. High activity in the "Time Difference" display is normal and to be expected.
For Power Core to sync correctly to PTP, PTP 2-step must be used (as opposed to PTP 1-step).
In PTP 2-step, the time stamp message is sent separately after the sync message. This allows devices such as Power Core to calculate the network delay of the route.
Global Data
This area shows the system's PTP mode, the active clock ID and address, and the grandmaster clock ID. These IDs may differ if your system uses a boundary clock.
Grandmaster Data
This area shows information about the grandmaster clock.
Master-Slave Engine
This area shows whether the master-slave engine is active, and displays the clock ID (used if master-slave is enabled).
RAVENNA → Inputs
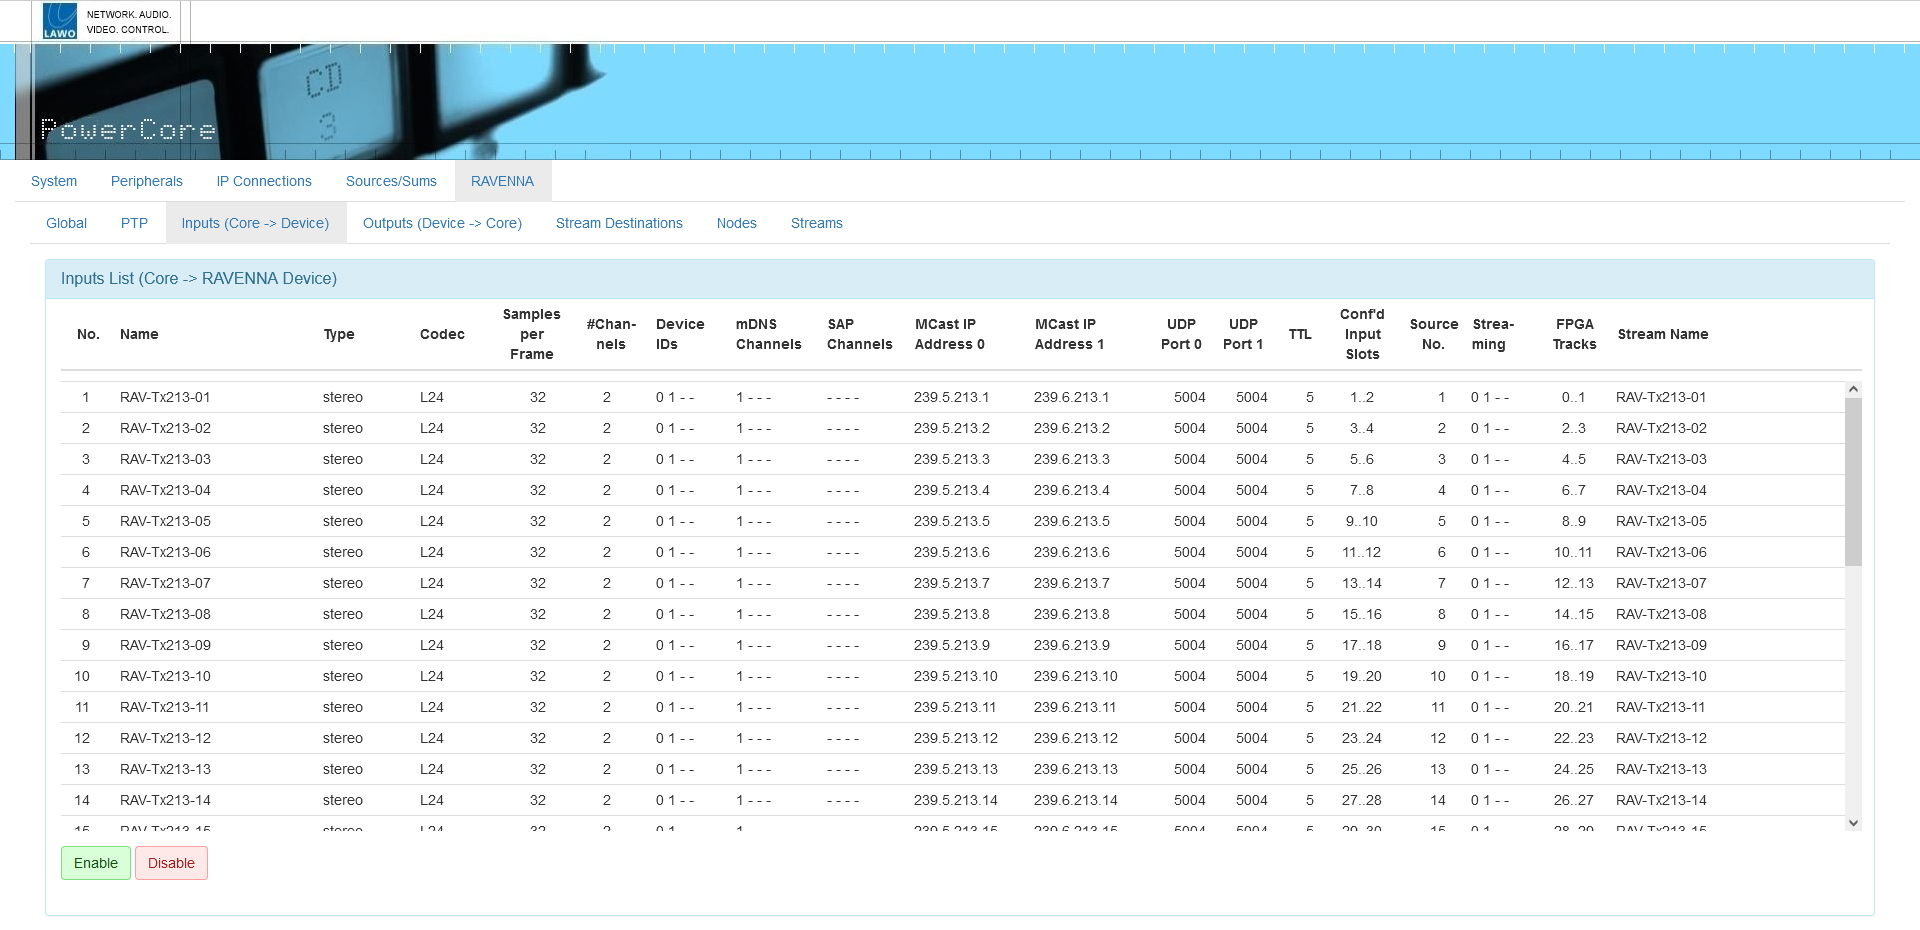
The RAVENNA → Inputs tab lists all of the RAVENNA senders (i.e. the streams supplied by Power Core to the network). The parameters are configured by the ON-AIR Designer; there are no editable fields.
The information includes the name, type, codec, audio sample rate, RAVENNA announcement protocol used, multicast stream address, UDP port number, stream TTL value (in seconds), the input slots of the RAVENNA device, and the tracks they use.
The "Streaming" column shows whether streams are in fact actually being transmitted from Power Core's RAVENNA interfaces. The four positions correspond to the front panel ports: ra0, ra1, ra2, ra3. A value indicates that the port is active: "0" for primary and "1" for secondary ports. If both "0" and "1" are present, then the stream is configured for redundancy (sending from both primary and secondary ports).
At the bottom of the page, the Enable and Disable buttons can be used to manually start and stop the sending of a stream. They should be used for troubleshooting only, and not for controlling senders during operation. In each case, the button opens a pop-up window where you can select the stream you wish to enable or disable. If the "Input Name" field is empty, then all of the senders are in the opposite state.

RAVENNA → Outputs
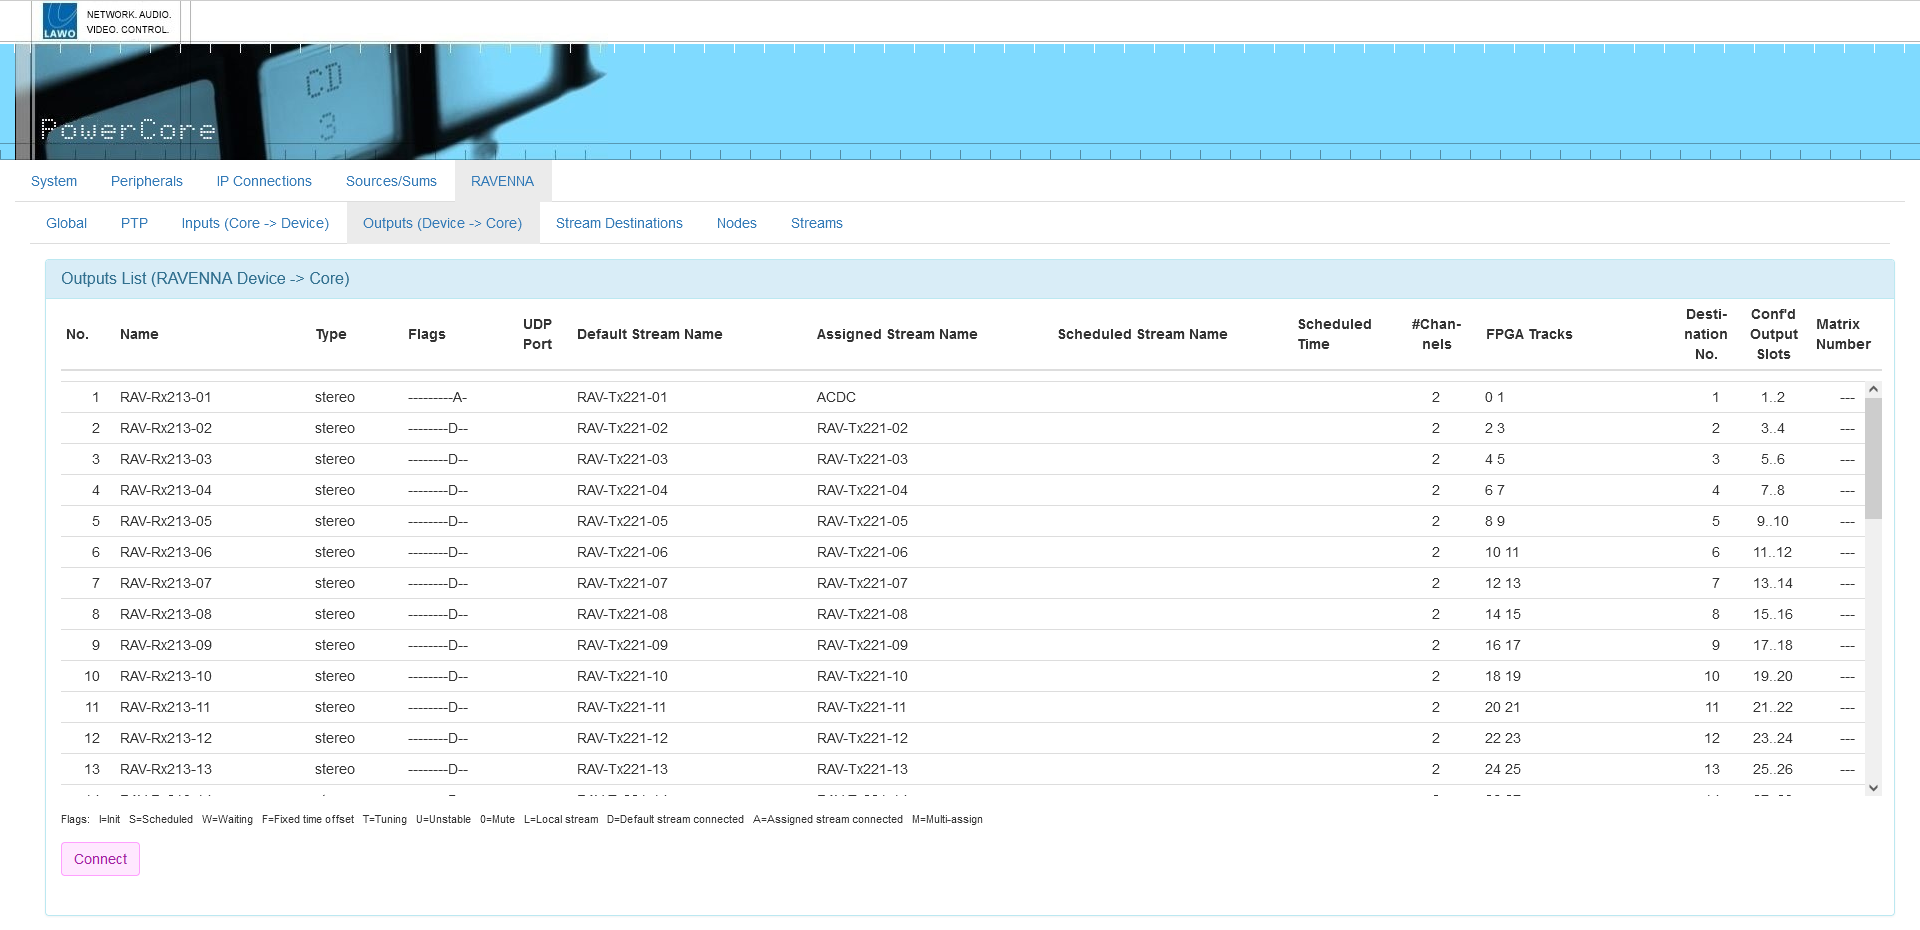
The RAVENNA → Outputs tab lists all of the RAVENNA receivers (that can consume streams from the network). As above, the parameters are configured by the ON-AIR Designer; there are no editable fields.
Of particular note are:
- Name & Type show the name and format of the receiver.
- Flags show information about the receiver (e.g. D = the default stream is connected). There is a key at the bottom of the page which explains the meaning of each flag.
- Default Stream Name shows the name of the stream that the receiver should subscribe to.
- Assigned Stream Name shows the name of the assigned stream following a successful subscription.
- Scheduled Stream Name shows the name of the scheduled stream (if make-before-break is enabled for the receiver).
- UDP Port shows the port number used by the receiver.
- #Channels and FPGA Tracks show the number of channels connected from the incoming stream and which tracks they use.
The "Default Stream Name" is optional (in the configuration) and can be used to permanently link the receiver to a stream. If a matching stream name is found, the receiver will automatically subscribe to it. In this instance, you will see the same name in both columns. If a Default Stream Name is not entered, then a stream subscription must be established using a different method. For example, by selecting a pool source on the console surface; using internal logic or external control via Ember+; or by manually connecting a stream via the Connect button (described below).
Clicking on a name in the "Name" column opens a pop-up window containing output data (information about the receiver and its connected stream).
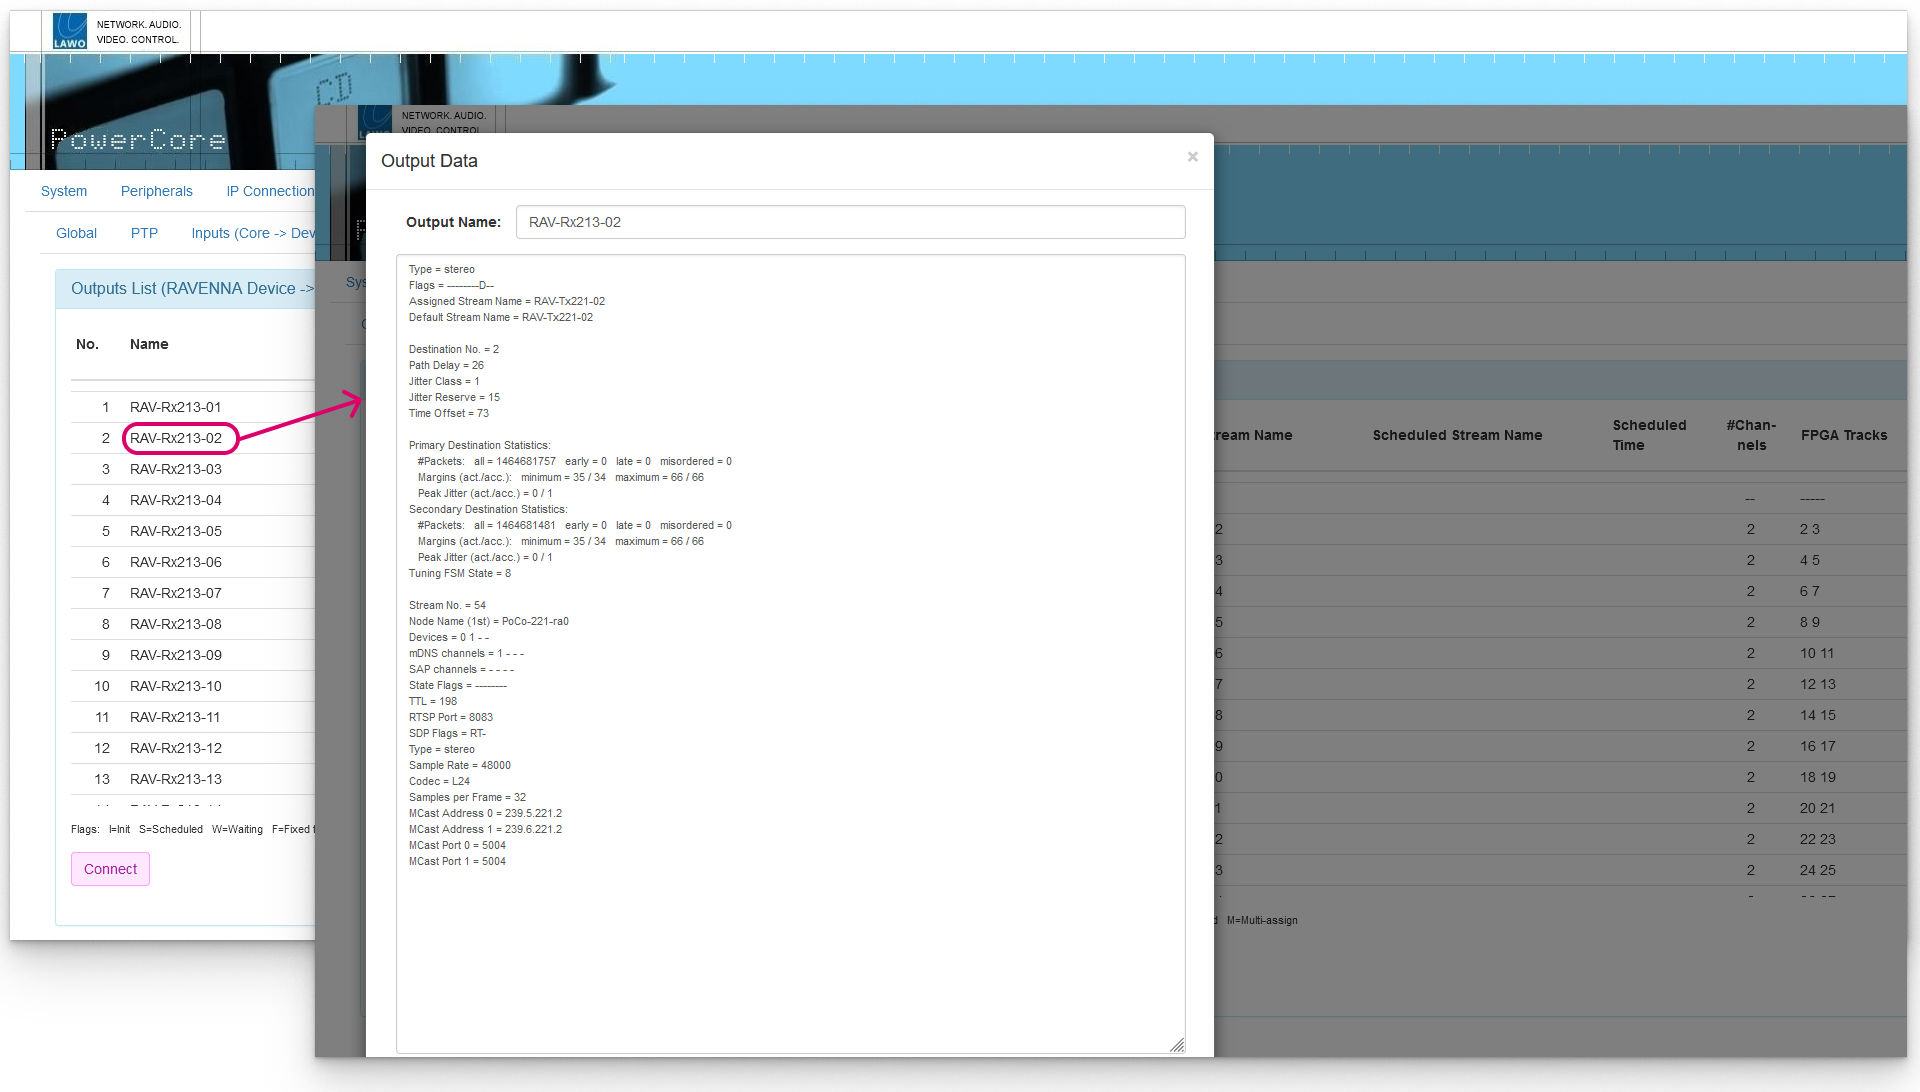
At the bottom of the page, the Connect button can be used to connect an incoming stream to one of the configured receivers. It should be used for troubleshooting only, and not as an operational tool. The button opens a pop-up window where you can select a receiver (in the "Output Name" field), and then the "Stream Name" you wish to subscribe to. The list of available streams is determined by the mDNS or SAP channel announcement.

RAVENNA → Stream Destinations
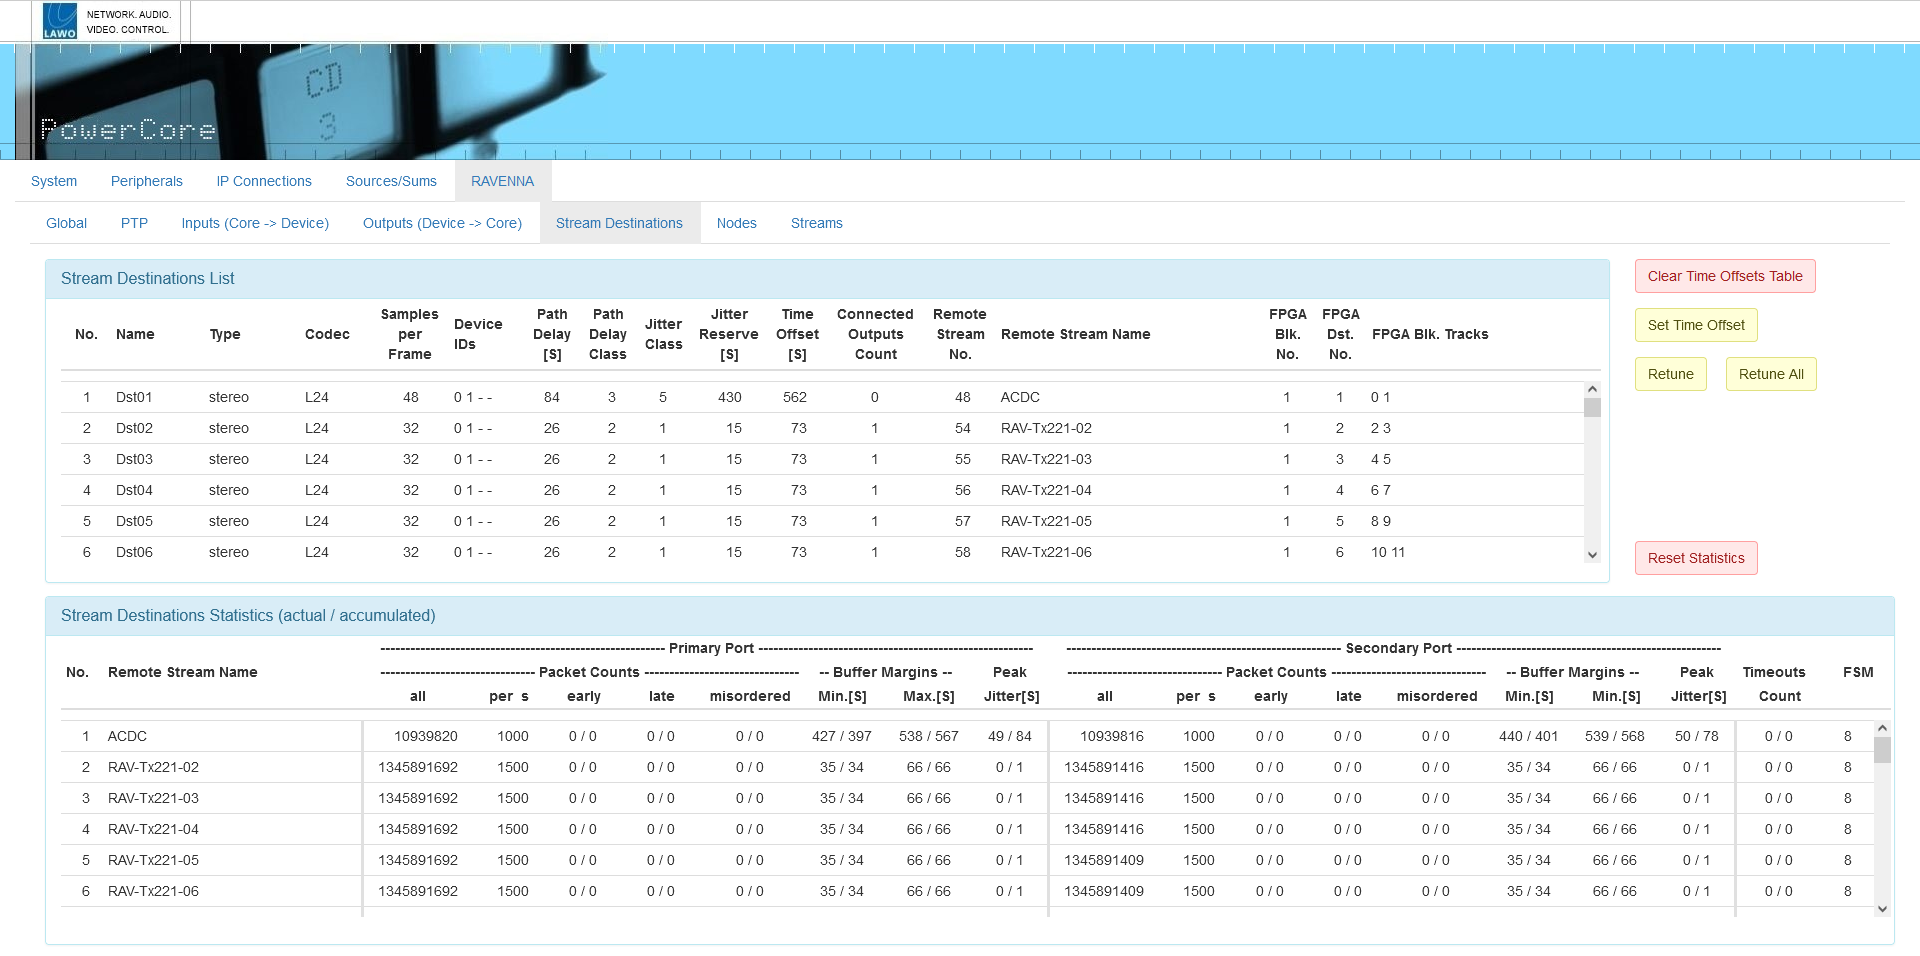
The RAVENNA → Stream Destinations tab shows the statistics for all of the stream destinations which are in use (i.e. all subscribed streams). It can be used to view information about stream latency and stability, and to "retune" streams which are not performing properly.
Stream Destinations List
This section shows information pertaining to individual RAVENNA streams. Data includes the number of audio channels, codec used, sample rate, number of subscribers listening to the stream, the Remote Stream name and number, and the numerical designations for the audio channels supplied. Streams with blank Remote Stream Name values are inactive or unavailable.
Of particular note are the Jitter Class, Path Delay Class and Time Offset values which are applied during stream tuning.
The Time Offsets for all streams can be cleared by clicking on the Clear Time Offsets Table button.
The Set Time Offset, Retune and Retune All buttons can be used to manually retune streams (as described later).
Stream Destinations Statistics
This section provides statistics that report on the health of the received Primary and Secondary streams. Data includes the Packet Counts for Early, Late and Misordered Packets, Buffer Margins and Peak Jitter.
Of particular importance are the Primary Port Early and Late Packets Counts. If large numbers are seen in these columns, along with degraded audio performance, the stream should be retuned to fix the problem. The FSM column indicates the status of the retuning process.
The stream statistics can be cleared by clicking on the Reset Statistics button.
RAVENNA → Nodes
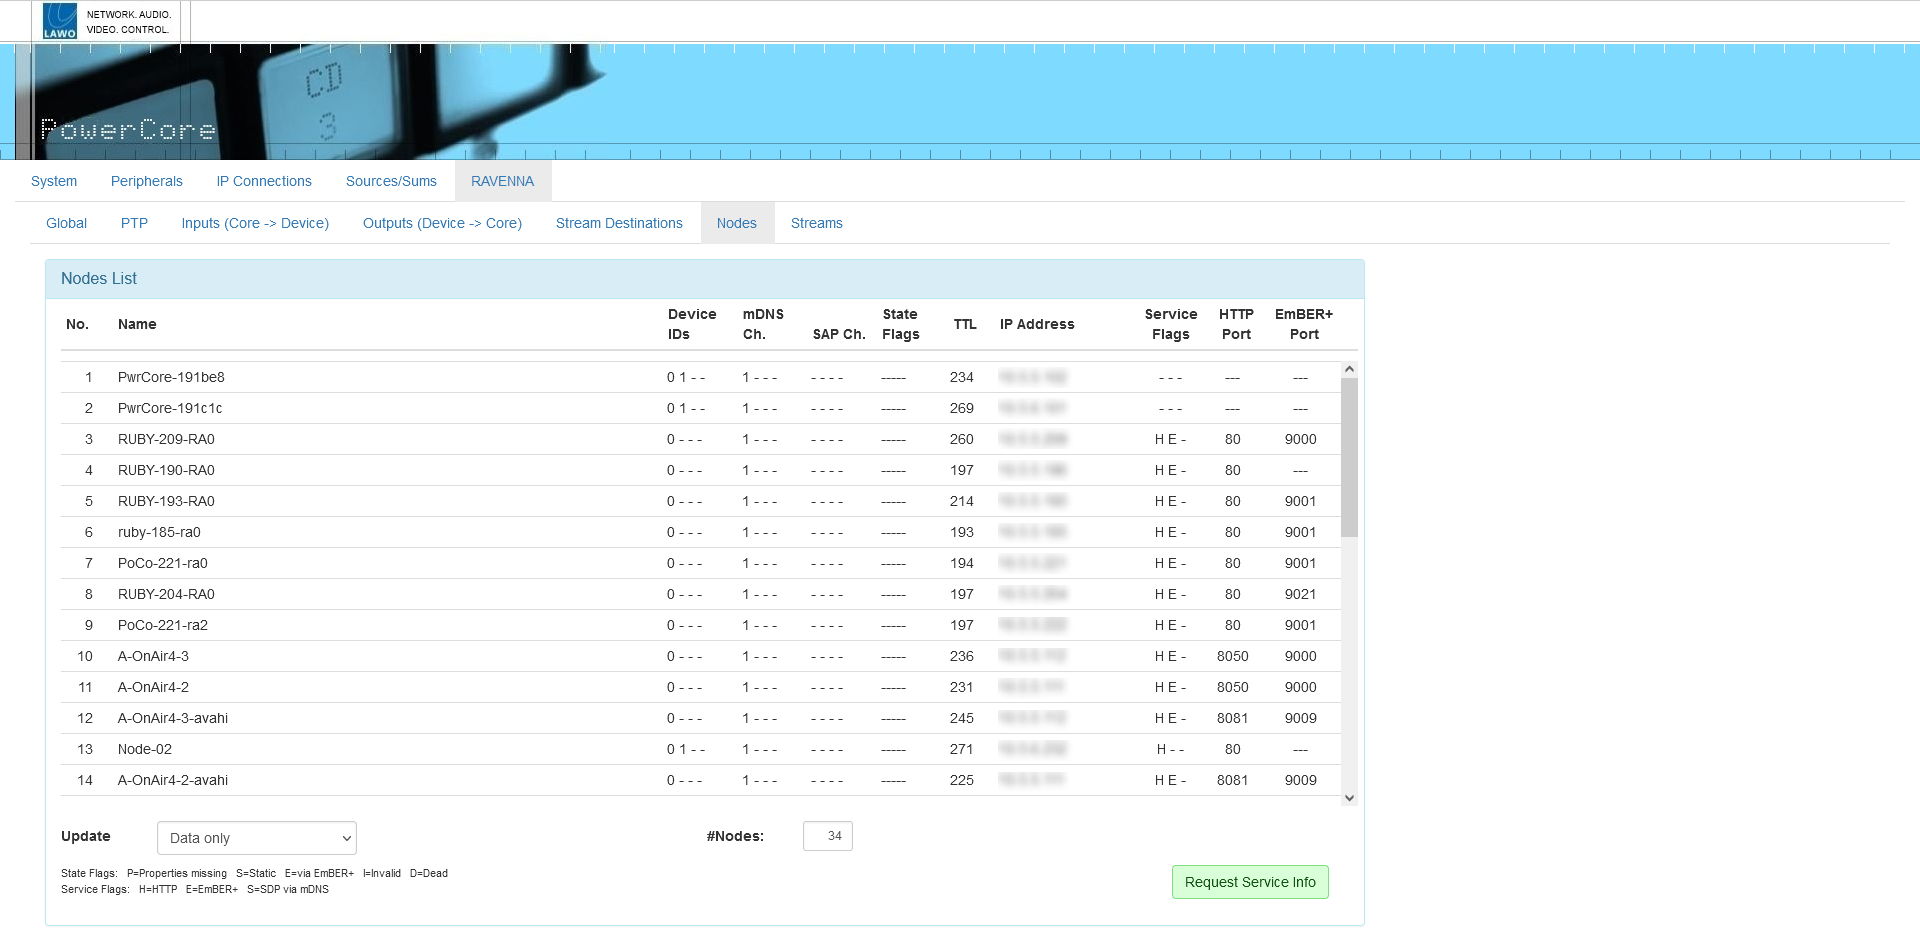
The RAVENNA → Nodes tab lists all available network nodes, showing their Device ID, announcement method (mDNS or SAP), TTL (in seconds), and IP address. Note that if static streams have been created using Ember+, then these are included in the list.
Pay particular attention to the "State Flags" as these show the condition of the network node. There is a key at the bottom of the page which explains the meaning of each flag.
Clicking on a name in the "Name" column opens the device's Web UI. You can use this to access further information in the usual manner.
At the bottom of the page is the Update selector. This can be set to one of two possibilities: Data only (the default) or Data + TTL. This defines what happens when the transmitter's MDNS / SAP announcement for a stream is made. If Data + TTL is selected, then the TTLs will be reset to the "Nodes List TTLs" value defined in ON-AIR Designer. Once the TTL count-down has expired, the node will remove the associated stream. This is generally needed only for diagnostic purposes.
RAVENNA → Streams
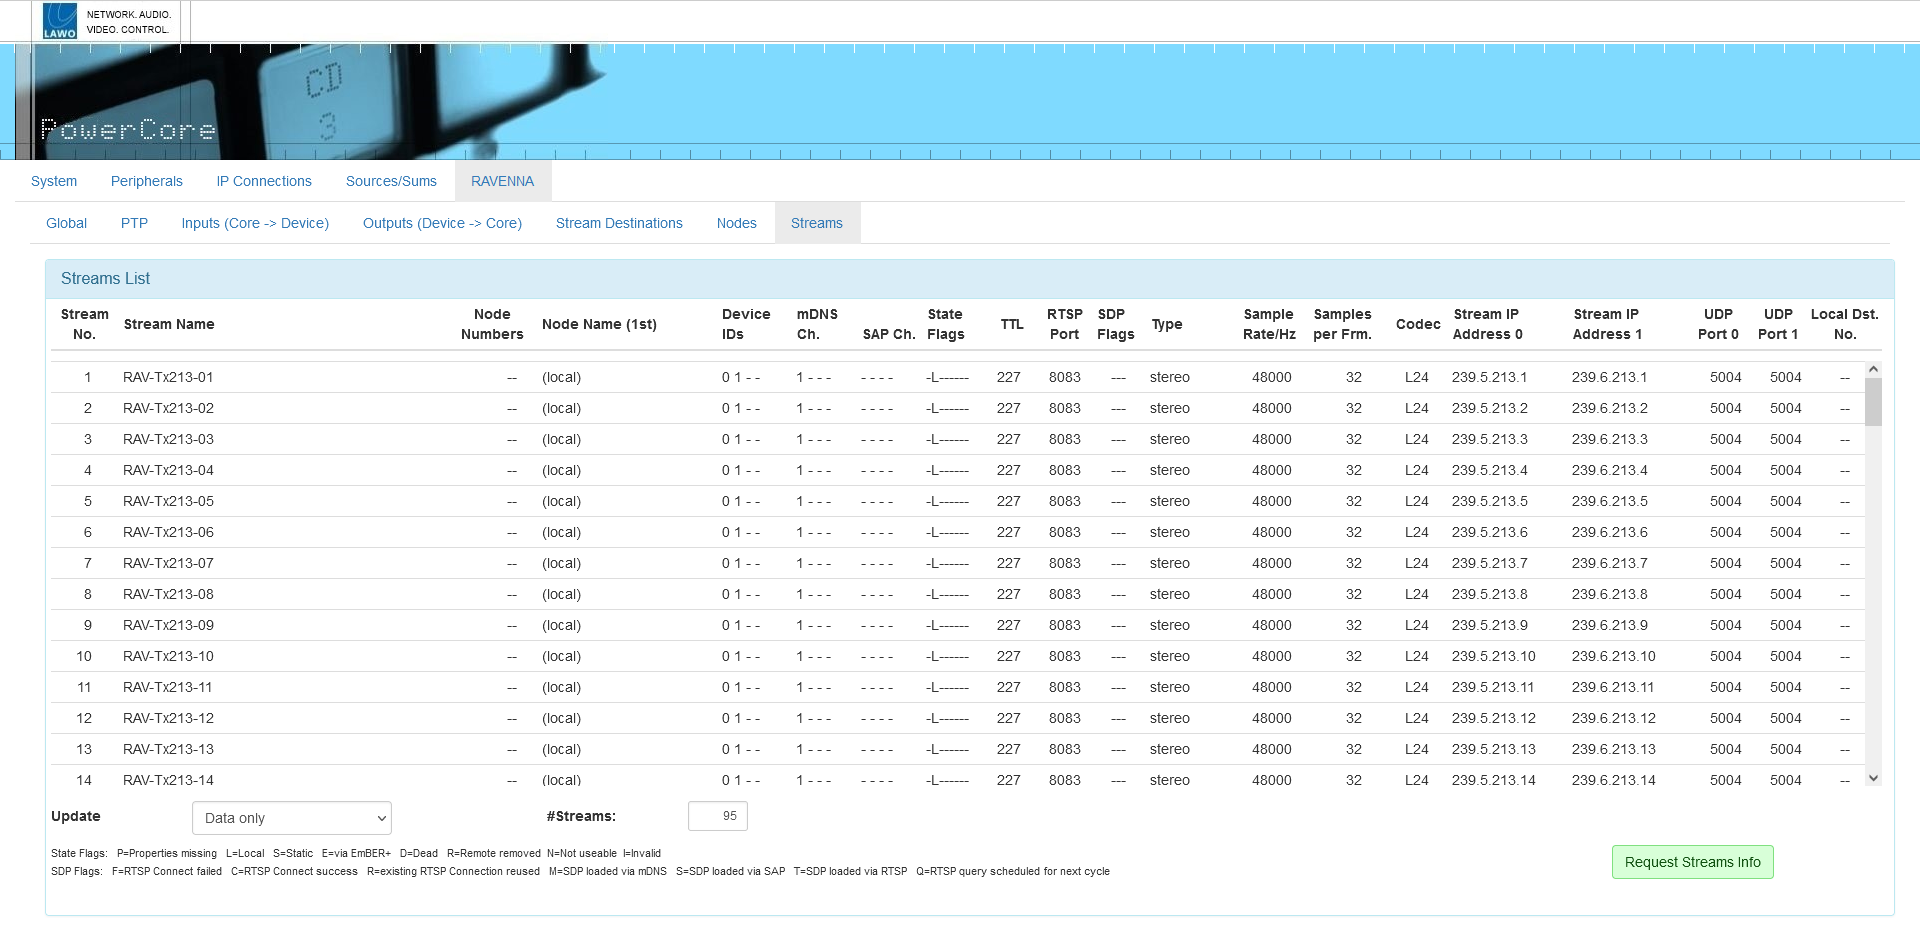
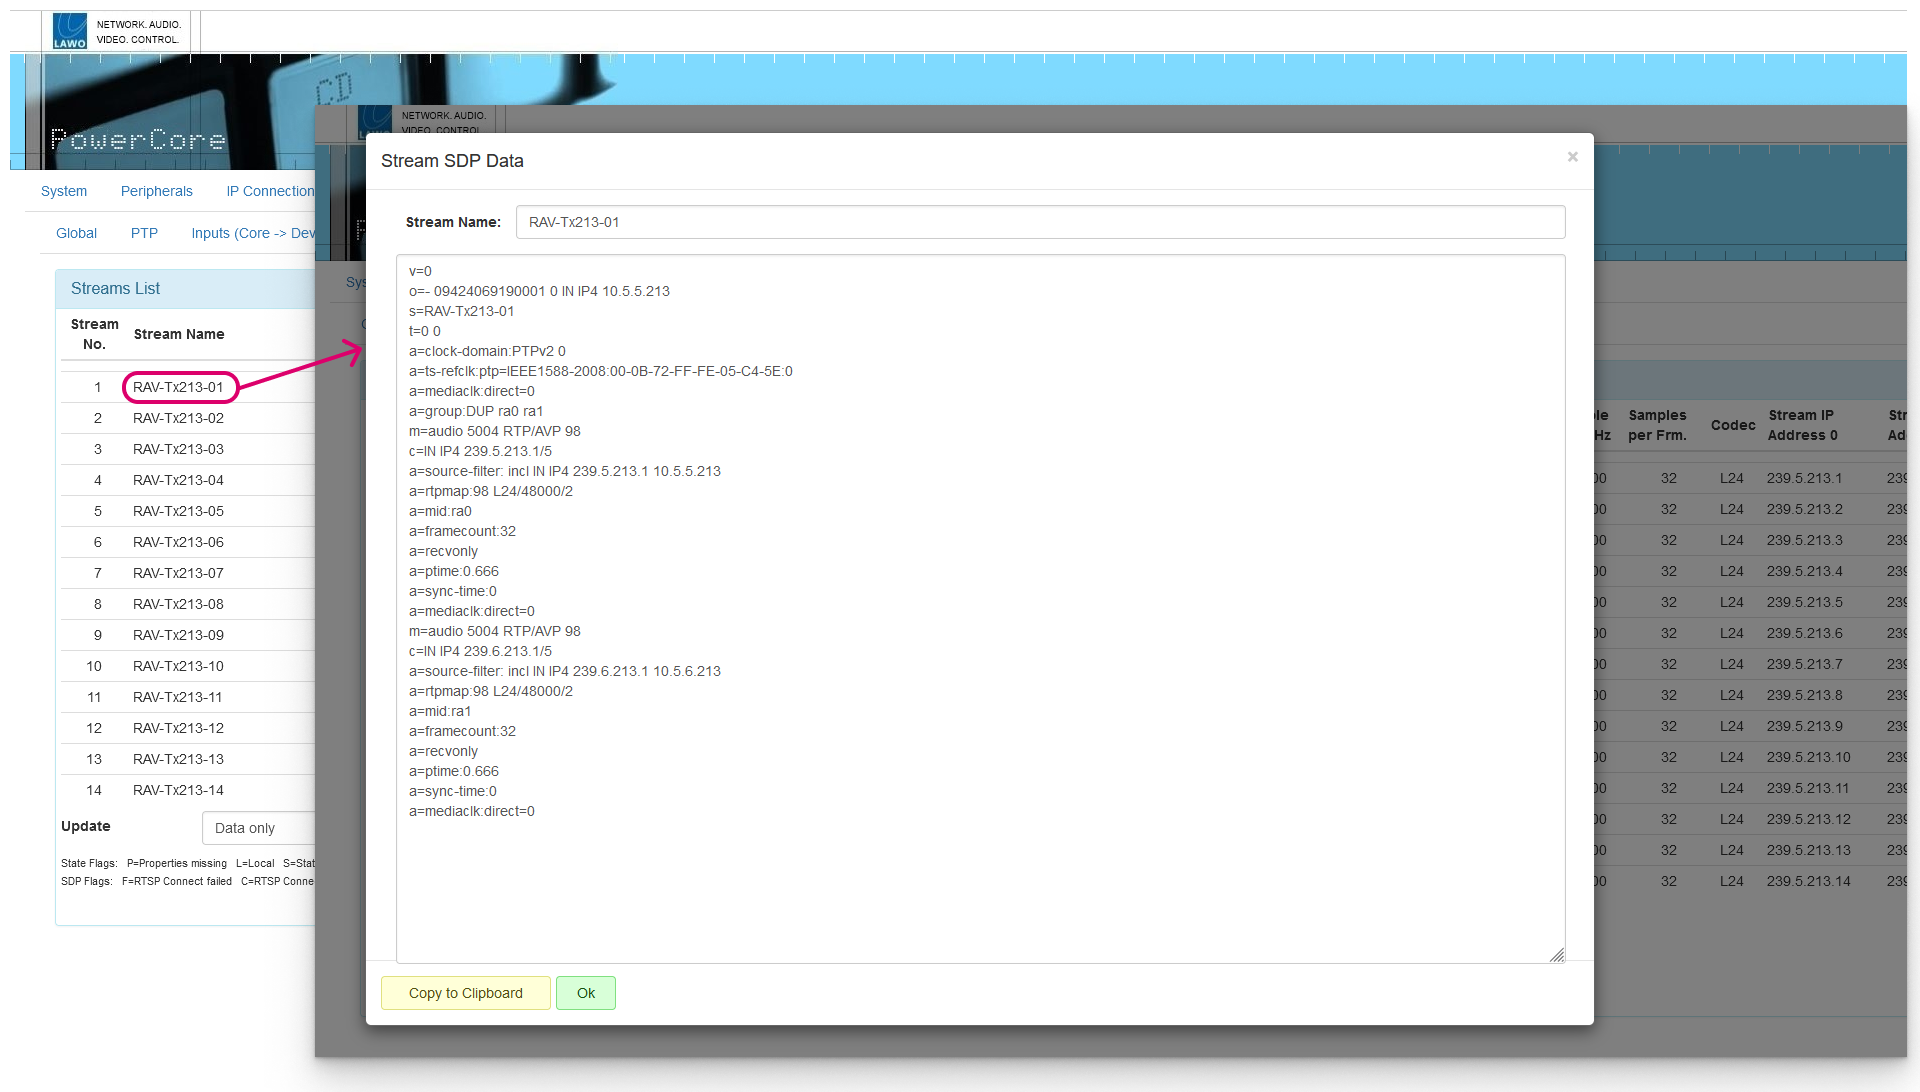
The RAVENNA → Streams tab lists all available network streams which have been announced to Power Core.
Pay particular attention to the stream "State Flags" which show the condition of the stream. There is a key at the bottom of the page which explains the meaning of each flag.
Clicking on a name in the "Stream Name" column opens a pop-up window where you can view and copy the stream's SDP (using Copy to Clipboard).
 At the bottom of the page is the Update selector. This can be set to one of two possibilities: Data only (the default) or Data + TTL. This works in a similar manner to the Update function in the Nodes tab, but the TTLs are reset to the "Streams List TTLs" value (defined in ON-AIR Designer).