HOME - Health Monitoring
The "Health" functionality of HOME supports users to get a comprehensive understanding of the current system status of their HOME-controlled environment.
Information is presented in two ways: through the "Health" icon (which appears on every page) and in the dedicated Health status page.
![]()
What is being indicated and why?
HOME's health status page shows warnings and critical issues reported by devices and systems managed natively in HOME. Also HOME microservices report issues if they occur. Each device/system is responsible for the information reported. HOME native devices and systems follow a global specification for severities and reported data, to ensure that comprehensible information is presented. All data shown represents the current "momentary" status of the whole system. It should allow operators to identify all active issues immediately after they occur, and then choose the right measures.
Where is the information shown?
Health-related information is indicated in various ways and levels of detail.
The Health Icon
In the HOME status bar, a Health icon is shown on the far right side.
![]()
A notification counter shown on the icon informs about all active notifications. "19" means that 19 issues are currently queuing in the health issues list. The background color of the notifier indicates the severity of a reported issue. If the background color is " orange ", the severity is a warning. Warnings are usually not affecting operation but should be monitored. Ideally, you plan actions accordingly. Critical issues are reported with a " red " notification. Critical Issues will overrun normal warnings, which means that a single critical issue will force a red notification icon to show up, even if various warnings (orange) are active in parallel. A critical issue usually should cause immediate interaction.
Clicking the health icon will navigate to the "Health" page, where you will be able to explore all open issues.
The Health Issue Pop-up
If you are working on other HOME pages than "Health", a pop-up will inform you about new issues that are occurring. The pop-up appears top-right of the HOME screen, just below the Health icon. It will appear for about 5 seconds before it disappears automatically. While the popup is shown, you can click the "X" icon to close the indicator. Alternatively, click the information "There are new health issues" to navigate to the Health page for details.
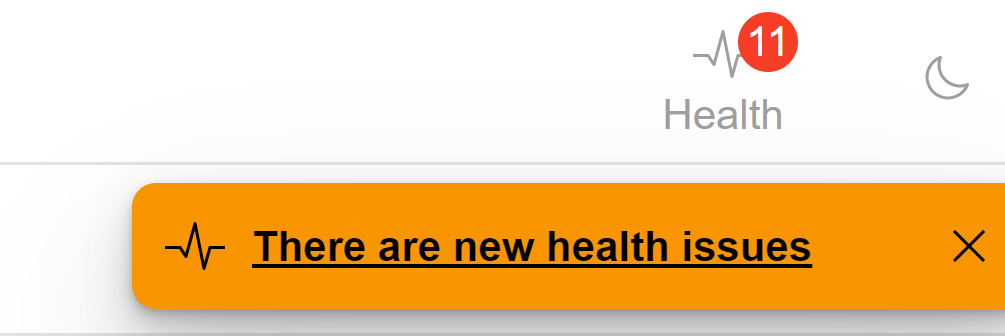
The background color of the popup indicates the category of the issue, which has triggered the popup. It does not reflect the severity of the triggering issue, but not the highest active issue severity.
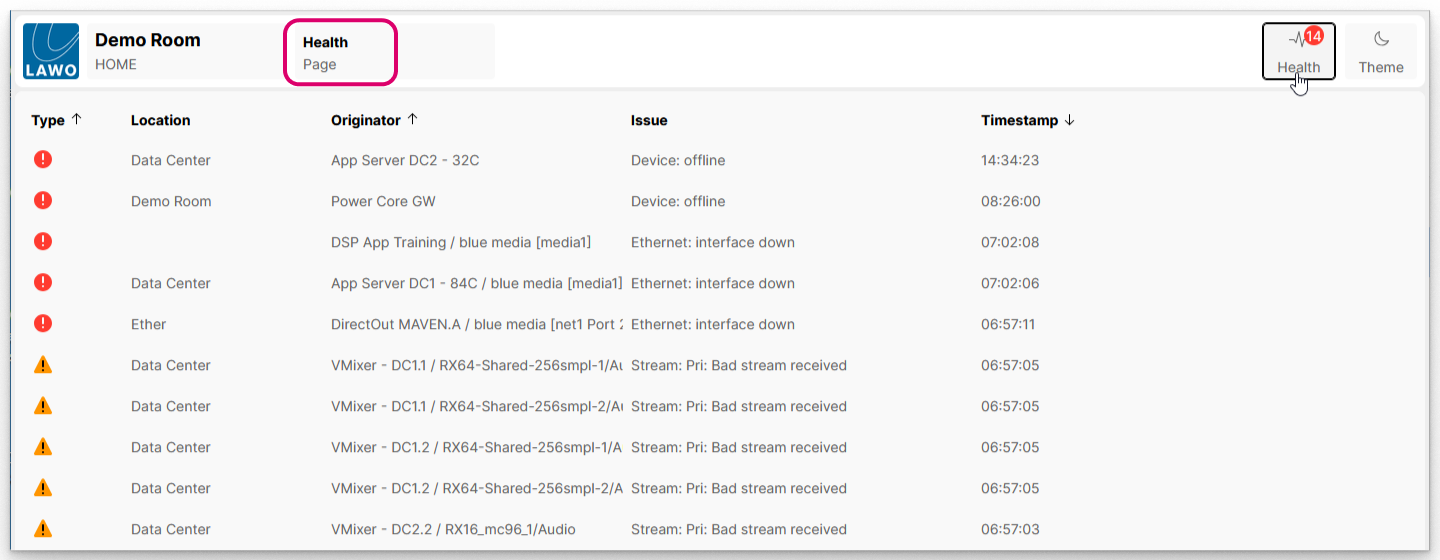
The Health Page
Clicking on the "Health" icon will navigate you directly to the health status page.
The health page shows all active issues reported to HOME.
Active issues are shown in a table, each line represents one issue. The information shown is separated into various columns.
| Column | Content | Detail |
|---|---|---|
| Type | Severity of the issue | Critical (red), Warning (orange) |
| Location | Location of the issue. | Shown, if location of originator has been set. If empty, location has not been set. |
| Originator | The source of the issue. | Can be a device, a virtual process or a service. |
| Issue | The actual issue. | Informs about what has happened. If you move your mouse pointer over the entry in the issue field, you will be prompted with additional information about the issue in a popup. A list of issues and potential help to be applied in case of occurrence can be found here. |
| Timestamp | The date and time of the last occurrence. | Indicates when the issue last occurred. If the table is sorted by this column, then it is easy to see which issues are the latest. This column previously operated as "Issue Opened" and showed the date of the first occurrence. From version 1.6, the operation is as described above. |
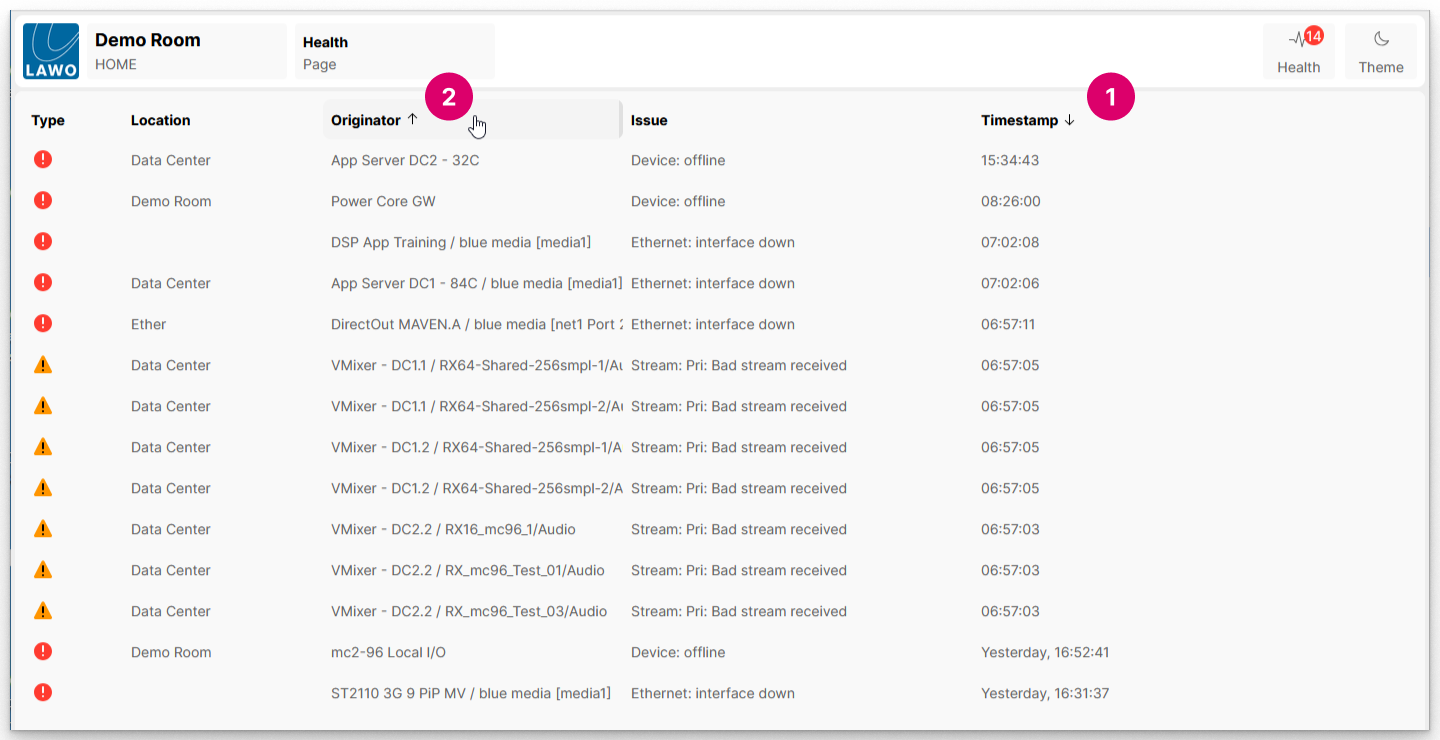
The table can be sorted by clicking on any of the column headers. Each click toggles the sort mode between ascending (A -> Z, earliest → latest) and descending (Z -> A, latest → earliest). An up or down arrow appears beside the header to indicate the current sort mode. You can swap the direction by clicking on the column header again.
For better visibility of issues, you can combine the column sorting functions. To do so, click on the first column header, press and hold the "Shift" key, and then click on the second column header. As a result, the content will be sorted by two columns.
An example is shown below, where the table is initially sorted by "Timestamp" (descending) to show the most recent issues at the top. If issues have occurred at the same time, then a second sort can be helpful. In this example, the second sort is by "Originator" (ascending).
To clear the column sorting, click on any column header repeatedly until the up/down arrows are cleared.
Understanding what is shown
The data displayed in HOME's health screen represents momentary status information reported by devices and systems which are actively operated in the managed infrastructure. If a device faces a severe issue, then it reports it to HOME, providing all data itself, including type and issue detail. The severity of an issue is defined within the device.
If a device has a broken PSU, you will be informed in HOME in either of two possible ways:
- If the device has a redundant PSU, it will report a broken PSU to HOME. Very likely this issue will be classified as a critical issue, requesting you to replace the broken PSU short-term.
- If the device has no redundant PSU, the device will not be able to report any critical warning. However, having known the device before, HOME will now warn you of a missing device, which has not been put "offline" officially. Consequently, you will be requested to take action.
In either case, the reported status will not change without your interference. Until it gets fixed, the reported issue will be permanently shown in the list, and the notifier on the health icon will be increased by 1. The fact the issue is permanently shown means that it is permanently present and does not change. Since HOME indicates the live status, the PSU issue will disappear automatically from the list, as soon as the PSU is replaced and the device is sending the next status update to HOME.
HOME's method of indicating live status results in a list of health issues, which are "currently" active. While some issues require external interference, other issues may disappear without any interaction. A possible example could be:
- A device operated in an air-conditioned room passes a temperature threshold and reports a warning. After a while, the warning disappears.
- Potential reason: The room's A/C was switched off for a short while to be serviced. During that time, the device temperature increased beyond the warning threshold. It normalized after the A/C was back on.
Questions and Answers
Why does the number of notifications increase and decrease automatically?
- Some issues occur temporarily and disappear after a while. Systems exceed thresholds of parameters, such as temperature or fan speeds, which may normalize after a while. Such issues cause the notifications number to increase and decrease.
Why do I get new issues indicated, but they don't seem to appear at the top of the list?
- Some issues occur frequently. If an issue occurs initially, it will be logged on the health page. If it occurs again at a later stage, this will cause a "new issue" popup to be shown, but it will not add a new entry to the list, as it exists in the list already, and has not been resolved yet.
Can I filter the list or apply any displaying options to the health page?
- It is possible to apply sorting options to the information presented on the health page. Filtering of data is currently not possible. Setting any displaying options is currently also not supported yet.
How can I export log data from my system for further processing?
- System status issues and other information are stored within HOME. It is possible to export application logs from HOME for external analytics. Follow this link to learn more.