In addition to the Grafana Dashboards, basic monitoring for an app or app server is available through the Advanced → Monitoring pages (in the HOME UI).
In this instance, all information is displayed as a simple text readout.
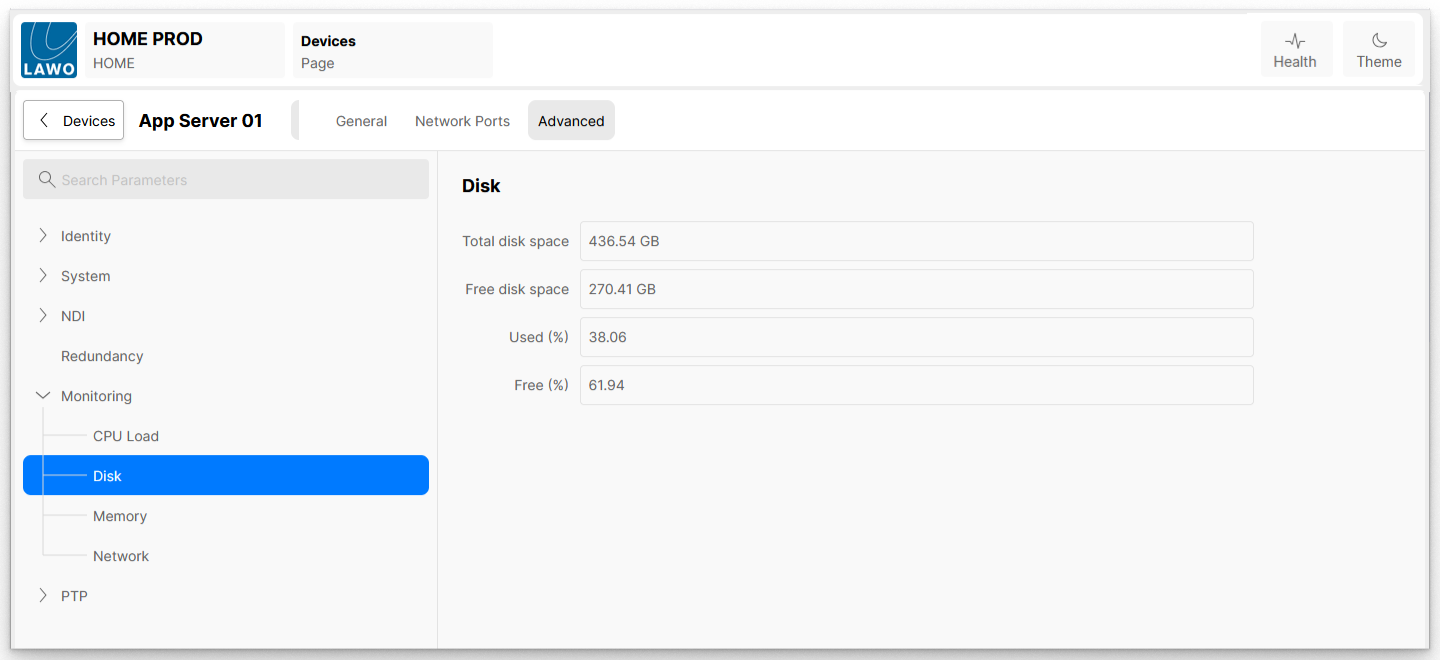
The example below shows how to check the Disk usage in an App Server:
- Total disk space - Displays the size of the hard disk installed in the App Server
- Free disk space - Displays the amount of unused space on the hard disk installed in the App Server
- Used (%) - Displays the amount of used disk space, as a percentage.
- Free (%) - Displays the amount of available disk space, as a percentage.
For more information, please refer to the "Advanced parameter control" topics for the individual apps or app server: