App Server - Advanced -> Monitoring
The Advanced → Monitoring menu provides information regarding the current workload of the app server.
Monitoring (via Grafana)
All apps, and app servers, provide various different metrics relating to performance. The metrics are stored in a database, and can be viewed on a graphical display via Grafana.
The Advanced → Monitoring menu (for an app server) contains a single Dashboard link to a predefined Grafana dashboard.
The link, when clicked, redirects the web-browser to Grafana running on the HOME server(s), where the user is prompted to log in (as described here). Once logged in, Grafana opens the selected dashboard.
For an app server, these metrics contain information relating to the server's resource utilization, application health, and network performance. This makes it easier to ensure efficient operation and identify any potential issues in real time.
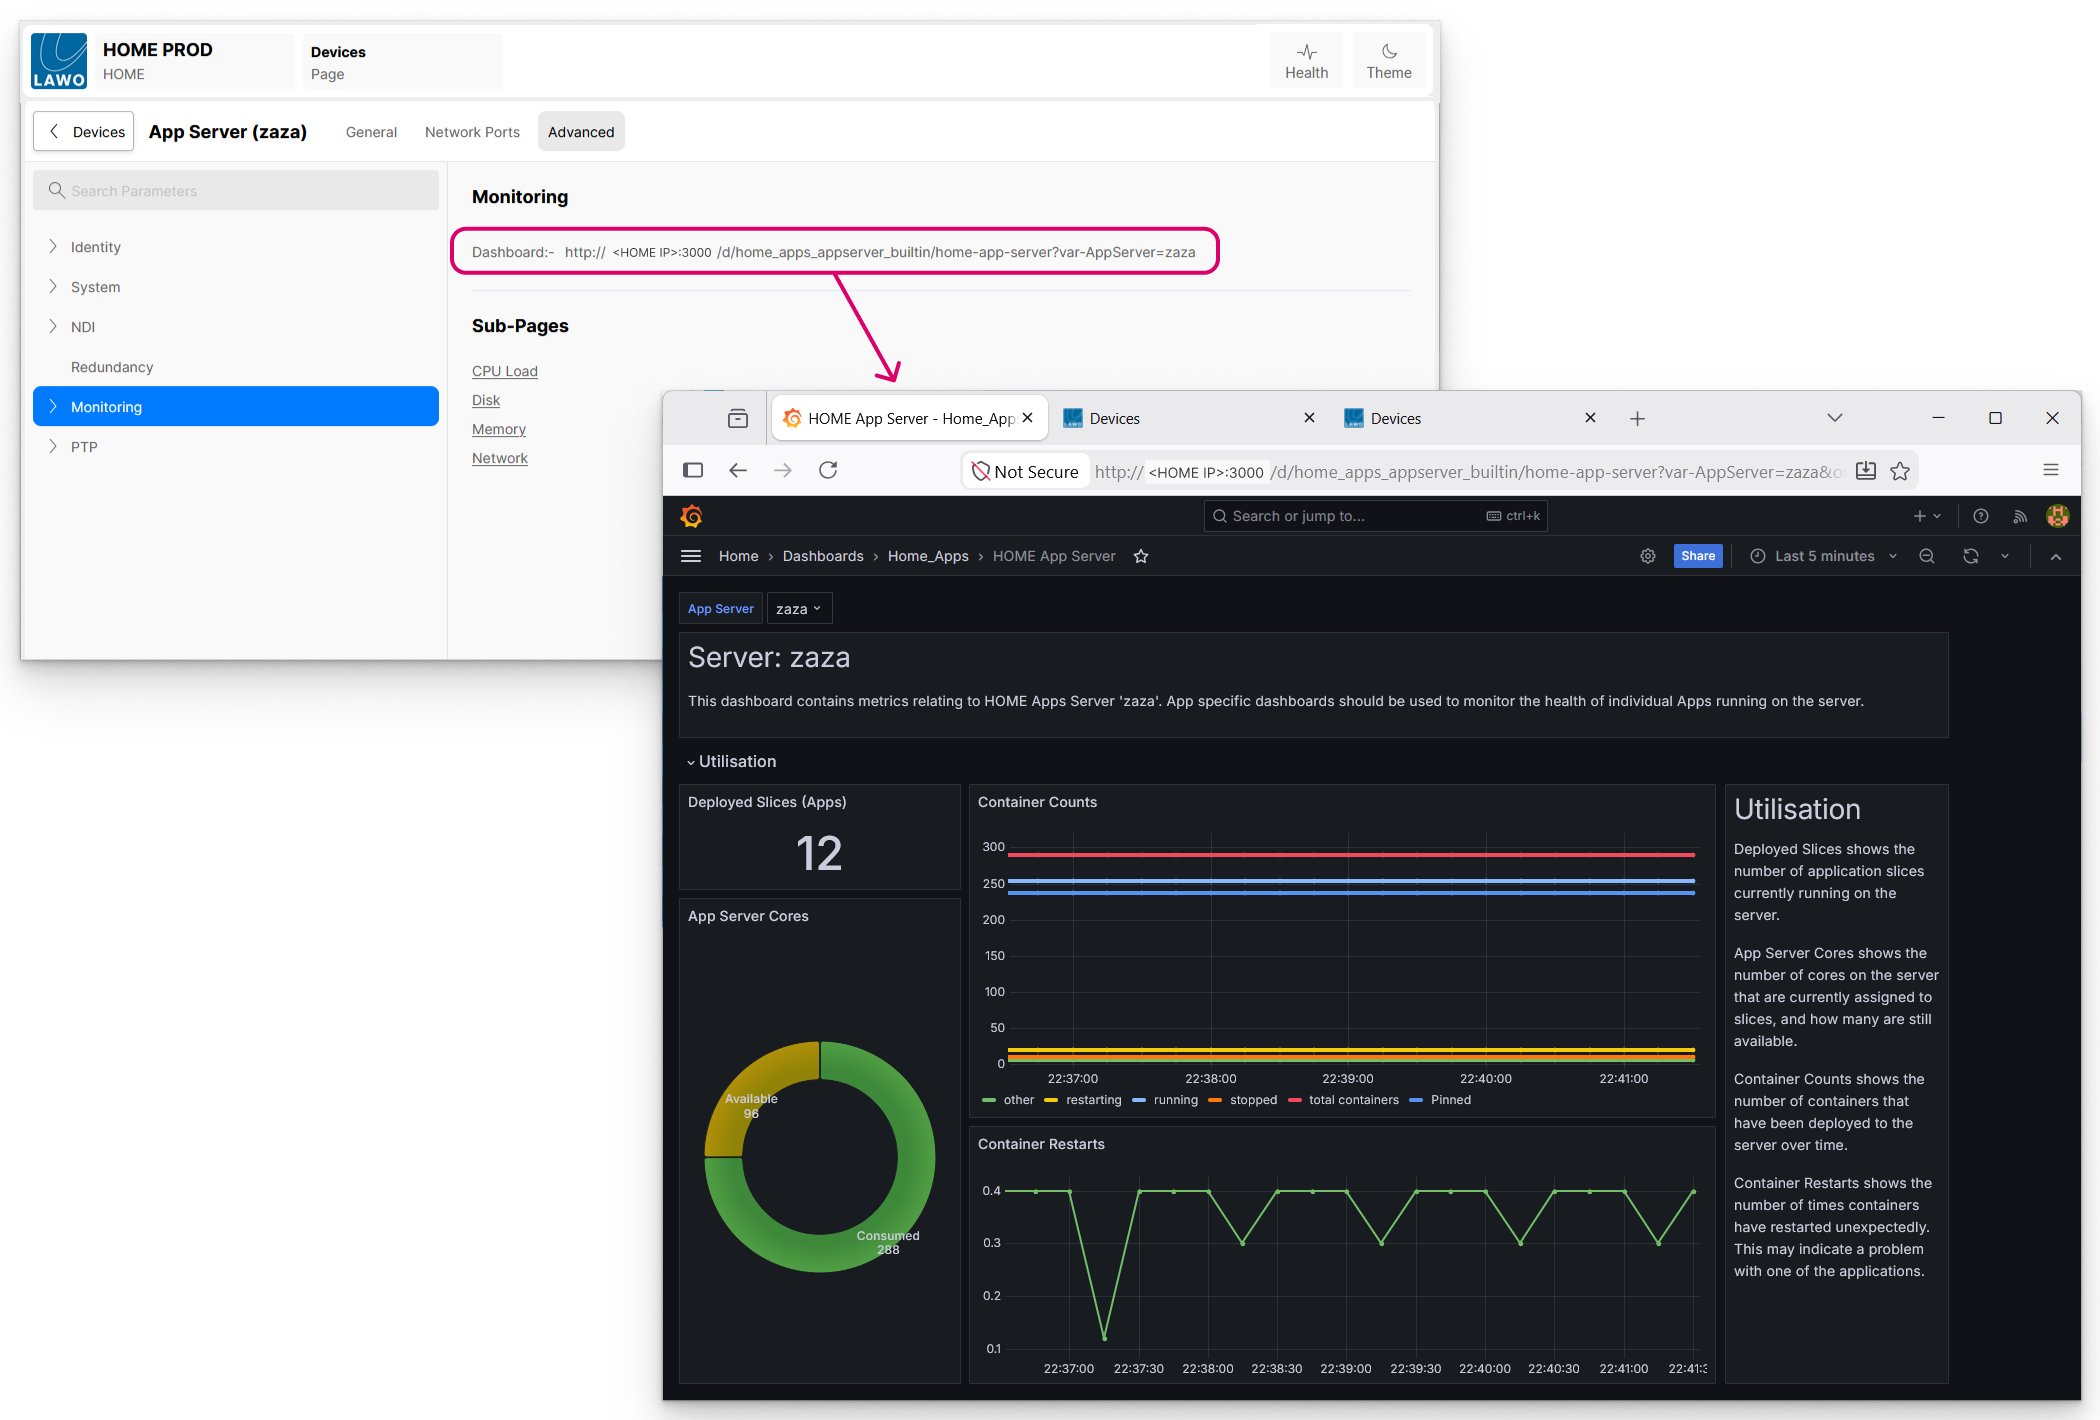
For more information, please see Performance Monitoring (using Grafana Dashboards).
Monitoring (via HOME)
Alternatively, basic monitoring is available through the four sub-pages: CPU Load, Disk, Memory and Network. In this instance, the information is displayed as a simple text readout (in the HOME UI).

All fields in these pages are for monitoring purposes (information only).
Monitoring → CPU Load
The CPU Load sub-page provides information regarding the current workload of all cores in the App Server's CPU:
- Max across all cores - Displays the utilisation level of the most utilised core, and which core that is (in brackets).
- Core # - Displays the current utilisation of the CPU core specified
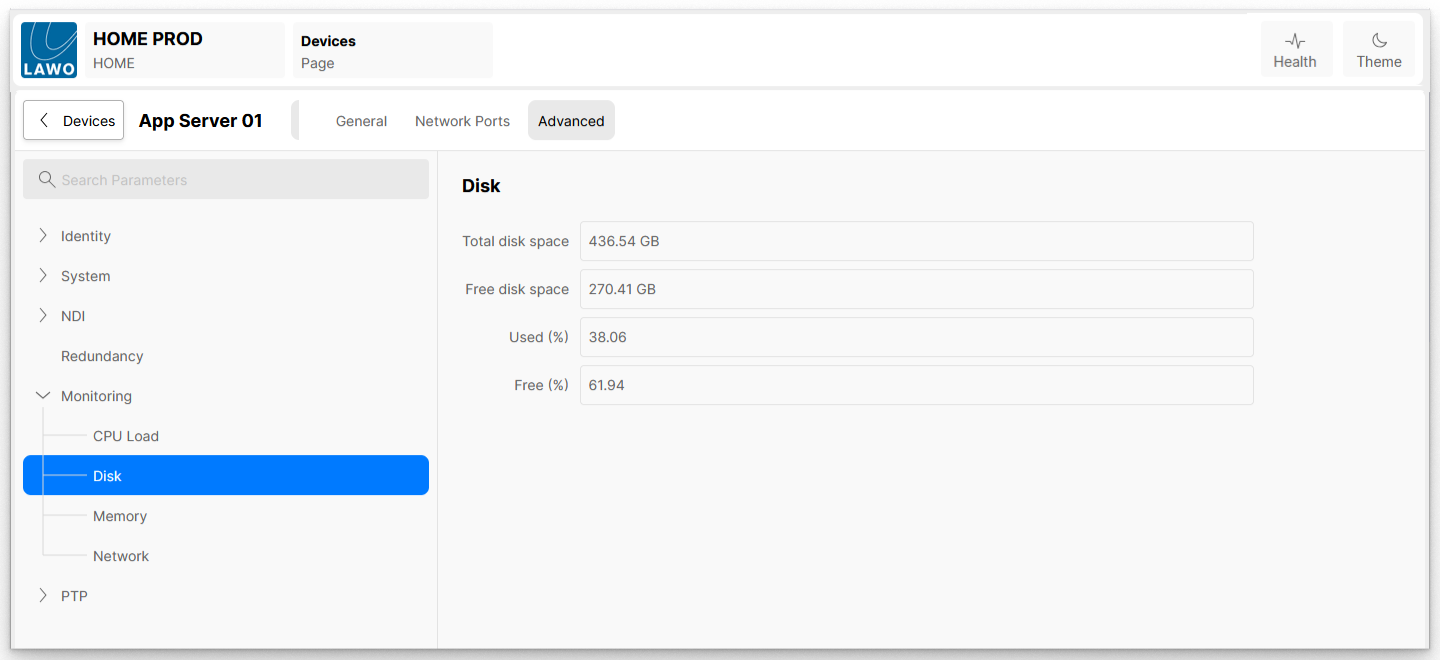
Monitoring → Disk
The Disk sub-page provides information regarding OS disk(s) installed in the App Server:
- Total disk space - Displays the size of the hard disk installed in the App Server
- Free disk space - Displays the amount of unused space on the hard disk installed in the App Server
- Used (%) - Displays the amount of used disk space, as a percentage.
- Free (%) - Displays the amount of available disk space, as a percentage.
Monitoring → Memory
The Memory sub-page provides information regarding the current RAM usage:
- Total Memory - Displays the total amount of Random Access Memory (RAM) installed in the App Server
- Available Memory - Displays the amount of unused RAM
- Used (%) - Displays the amount of used RAM, as a percentage of the Total RAM. This value will include RAM used by the OS and by Apps.
- Available (%) - Displays the amount of available RAM, as a percentage of the Total RAM. This RAM is available to any Apps which are not currently running on the App Server.
Monitoring → Network
The Network sub-page provides information regarding the current usage of the Management network interfaces:
- Management A RX - Displays the amount of network traffic arriving on the Management A Network Interface.
- Management B RX - Displays the amount of network traffic arriving on the Management B Network Interface.
- Management A TX - Displays the amount of network traffic leaving on the Management A Network Interface.
- Management B TB - Displays the amount of network traffic leaving on the Management B Network Interface.