HOME Apps - Performance Monitoring (using Grafana Dashboards)
All apps, and app servers, provide various different metrics relating to performance. The metrics are stored in a database, and can be viewed on a graphical display via Grafana.
The Grafana Dashboards provide essential insights for monitoring the health of, and managing, a HOME Apps system.
This topic describes how to access the dashboards and interpret the key information:
Using Grafana
Grafana is a separate, browser-based application that runs on the HOME management server(s) and is included with the HOME Apps system.
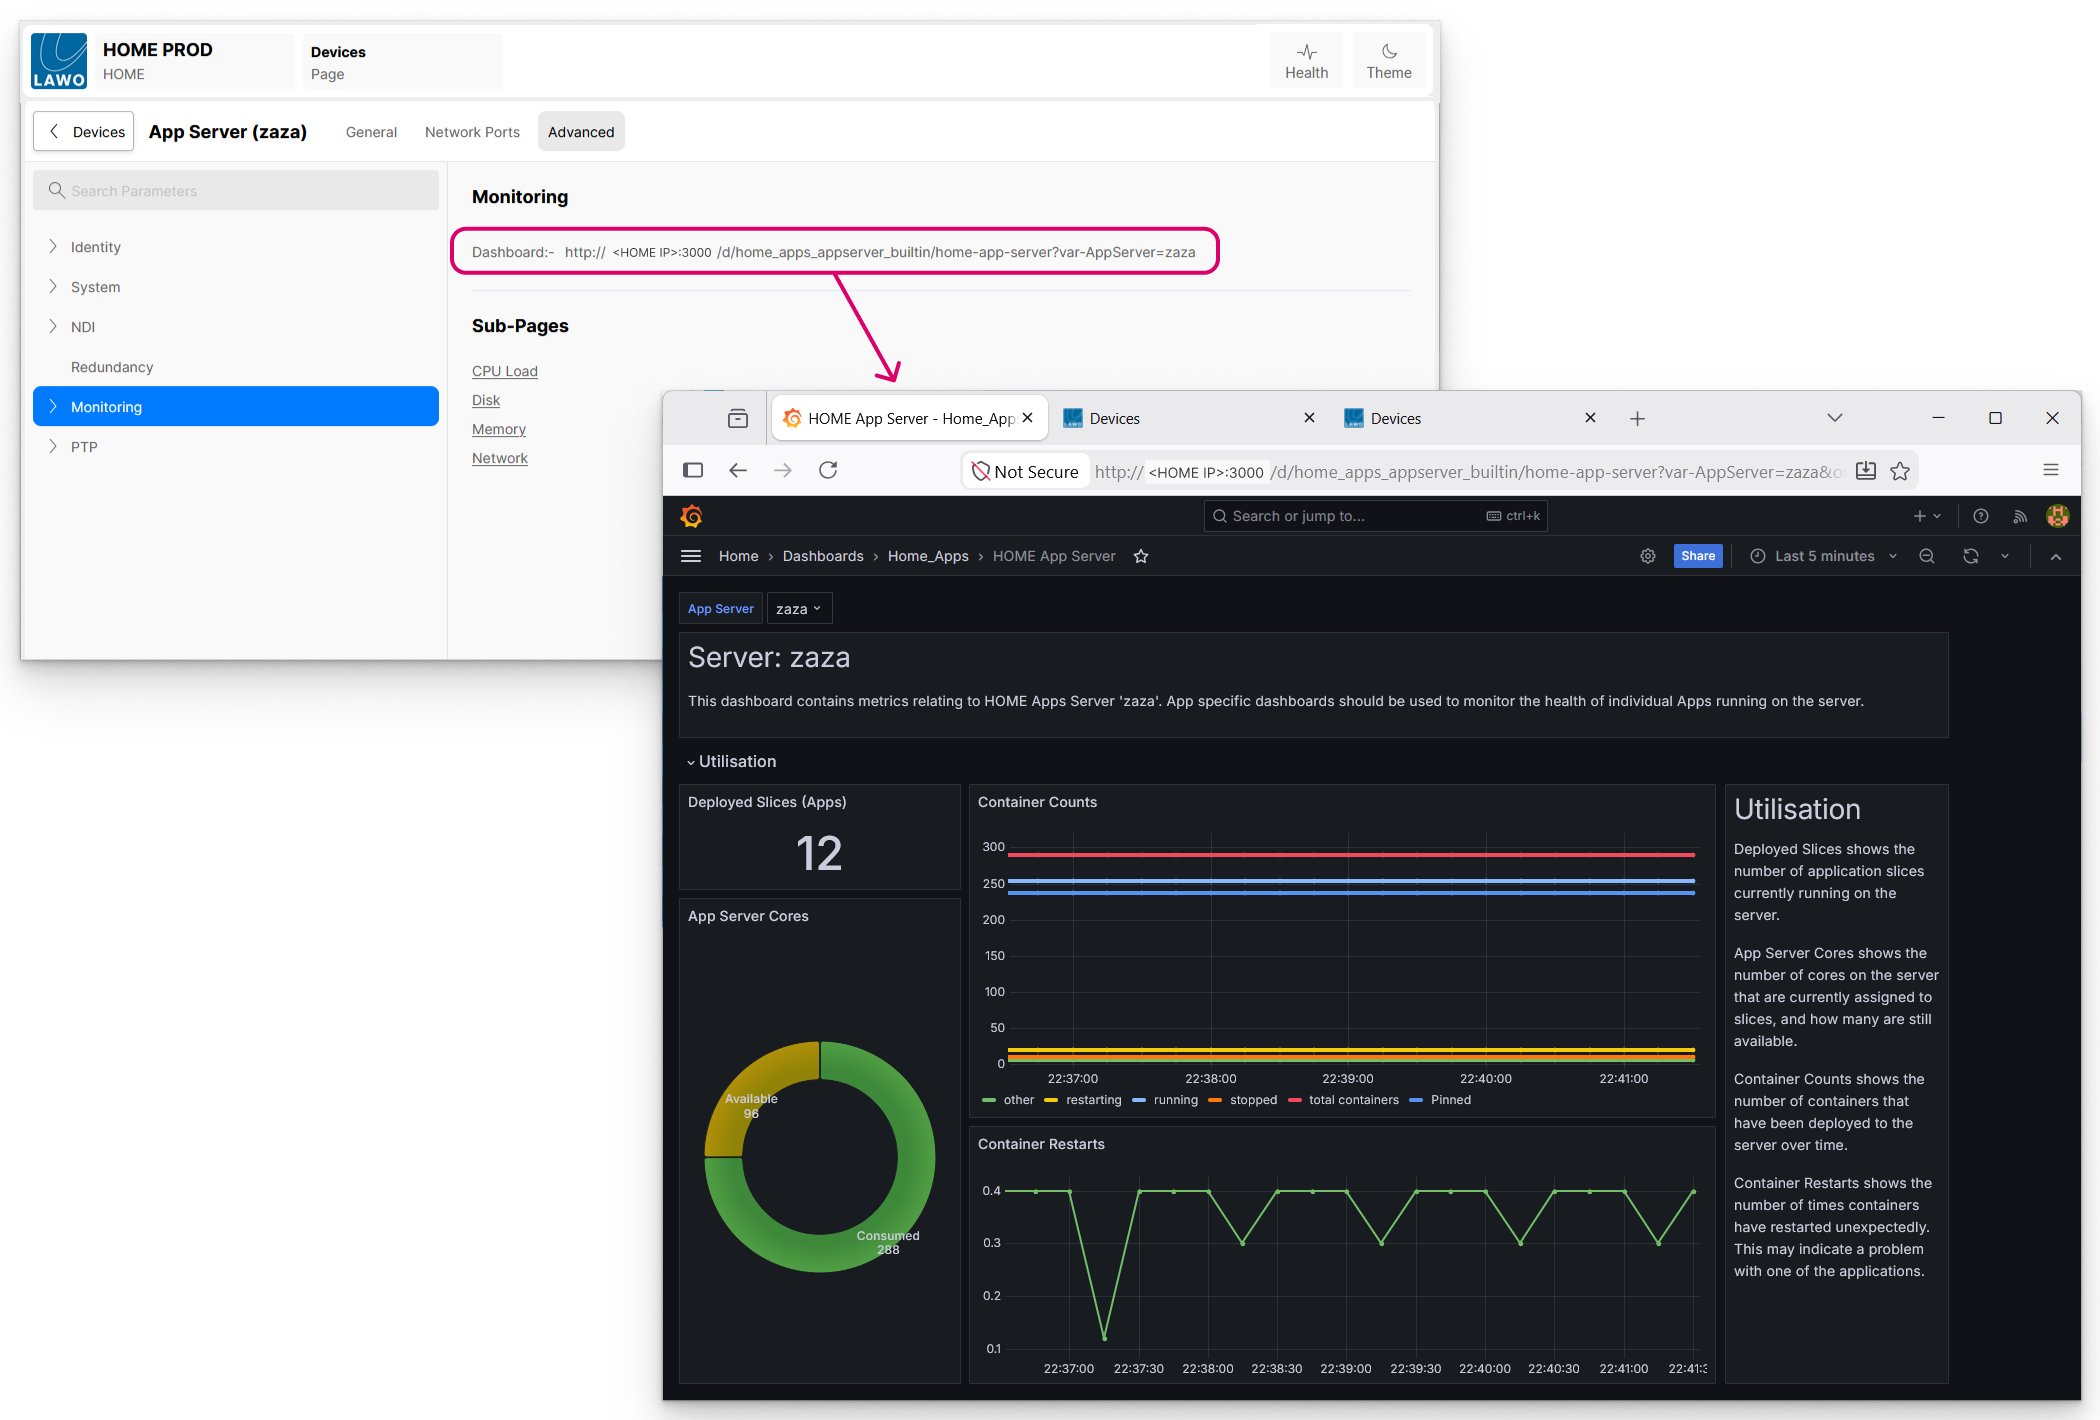
When the user clicks on one of the 'Dashboard' links provided, this redirects the web-browser to a Grafana Dashboard - for example, to view information about the app server:
First-time Log In (default credentials)
When opening Grafana for the first time, the user is prompted to log in.
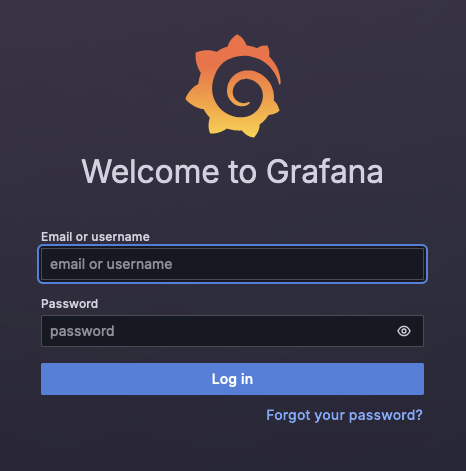
The default credentials are admin / admin for the Username / Password.
If this is a first-time log in, then you may be prompted to change the admin user password. Either do this now or select Skip to keep the existing credentials.
Once logged in, Grafana opens the selected dashboard.
Changing the Admin Password
Different users can be created in Grafana according to the customer's requirements.
To keep the connection secure, it is recommended that customers change the default admin password. The admin is then able to create different user accounts in Grafana, where each user is assigned one of three roles:
Viewer - they can view dashboards.
Editor - they can view and edit dashboards.
Admin - they have full admin access.
For more information, please refer to the Grafana documentation at: https://grafana.com/docs/grafana/latest/administration/
It is strongly advised that each user in Grafana has their own login credentials!
Please note: Grafana is a separate interface to HOME, and so creating users in Grafana has no affect on HOME Apps. In addition, the users defined in HOME and Grafana are not synchronised.
Access via Port 3000
All available Grafana Dashboards can also be accessed by opening a new browser tab and entering IP address of your HOME system followed by the port number 3000.
i.e. 10.10.10.10:3000
Navigation
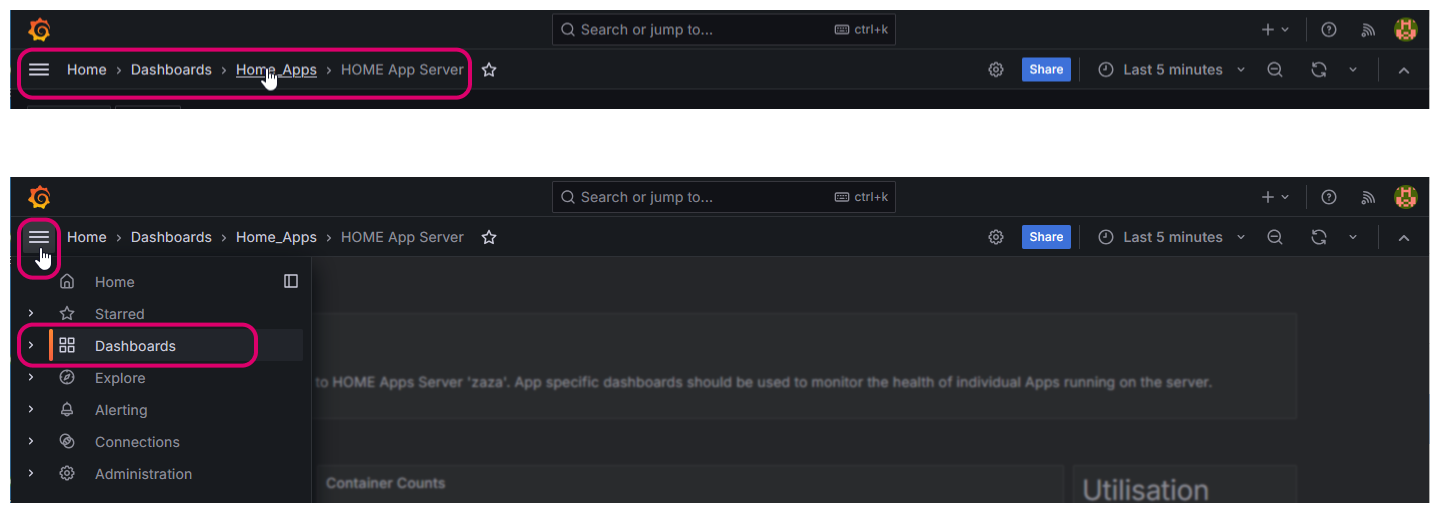
Once a Grafana Dashboard is open, other dashboards can be accessed using the navigation in Grafana. The image below shows a couple of examples.
For more information about Grafana, please refer to the Grafana documentation (available from the Grafana Home page).
Note that, while Grafana is capable of creating customized layouts, the dashboards used by HOME have a pre-defined layout, to provide consistent information across all Lawo products.
Grafana Dashboards - Overview
The Grafana Dashboards provide essential insights for monitoring the health of, and managing, a HOME Apps system. Various dashboards are available, depending on the type of app / app server.
In HOME Apps, the key dashboards include:
- HOME App Server - available for app servers; shows resource utilization, application health, and network performance.
- HOME App Server PTP - available for app servers; shows PTP clock synchronization.
- HOME App - available for individual apps.; shows application health.
- HOME App ST2110 Rx or Tx - available for individual apps; shows health of receivers (or senders).
- HOME App ST2110 Iris - available for individual apps but most relevant to HOME mc2 DSP; shows health of the DSP app's audio receivers.
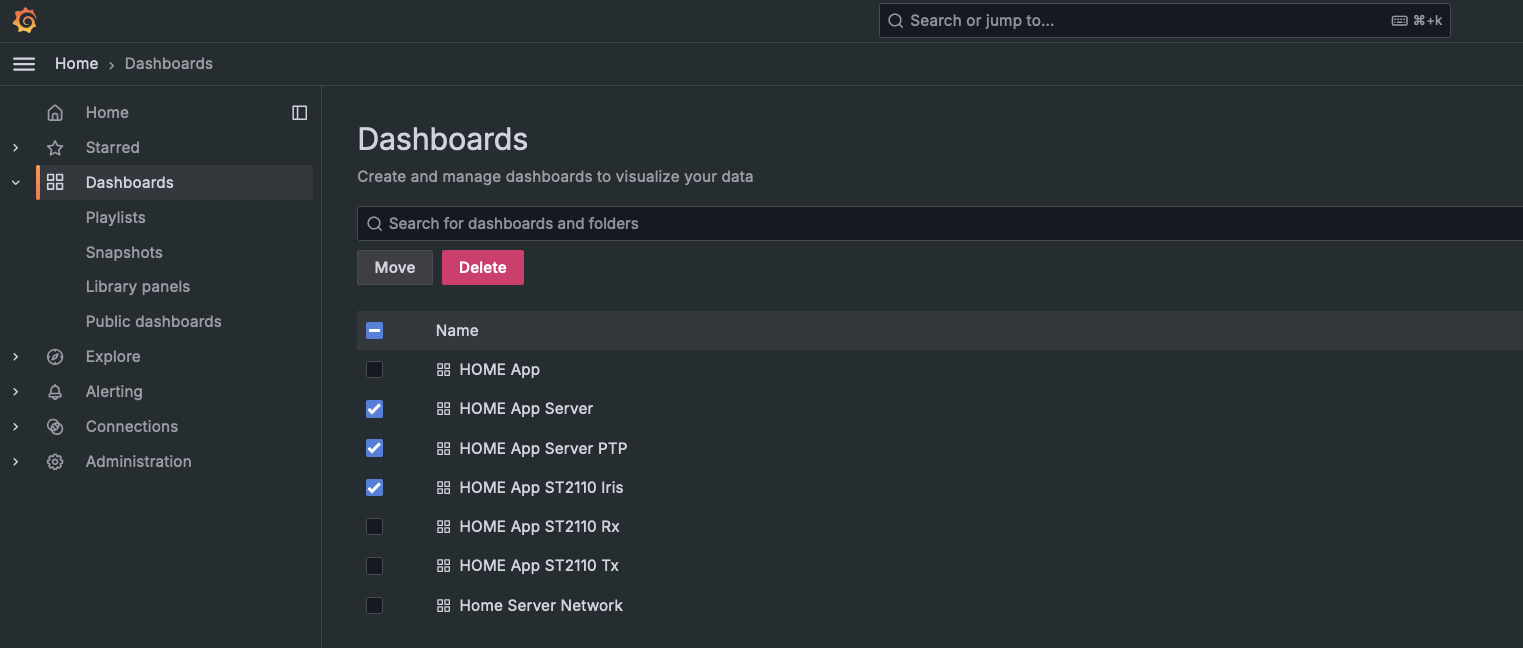
Together, these dashboards ensure comprehensive visibility for managing and troubleshooting various aspects of the system, including application performance, synchronization, and media network traffic.
App Server Dashboards
The HOME App Server dashboards offer a range of features to help monitor and manage the workload of the HOME Apps Servers.
These metrics enable a clear understanding of the server's resource utilization, application health, and network performance, making it easier to ensure efficient operation and identify any potential issues in real time.
This dashboard can be viewed for individual app servers. Use the App Server drop-down menu to choose which server to monitor:

The dashboard is divided into five areas: Utilisation, CPU Load, Memory Usage, Disk Usage and Network Traffic.
Utilisation
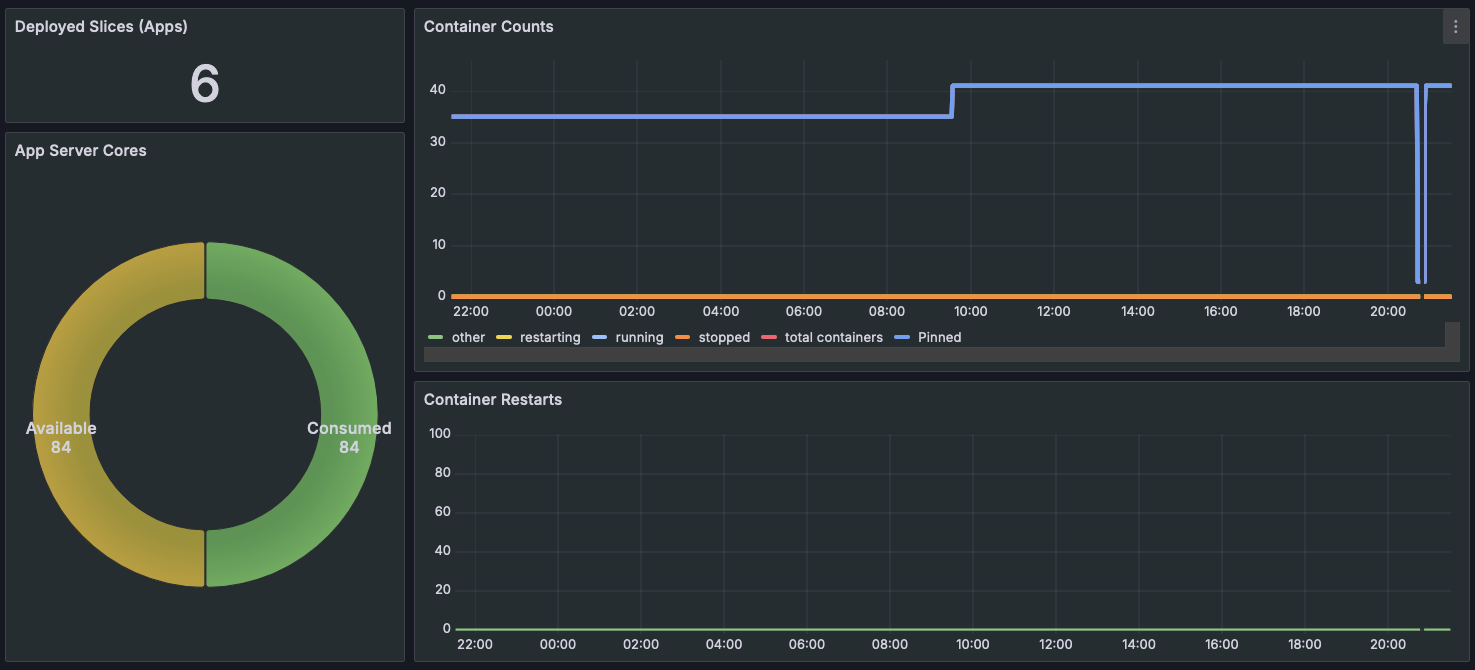
Provides an overview of the app server workload:
- Deployed Slices - the number of active application slices on the server
- App Server Cores - the CPU cores allocated to the server slices: consumed versus what is available
- Container Counts - the historical number of deployed containers
- Container Restarts - the historical number of unexpected container restarts. Frequent restarts could signal a potential issue.
CPU Load
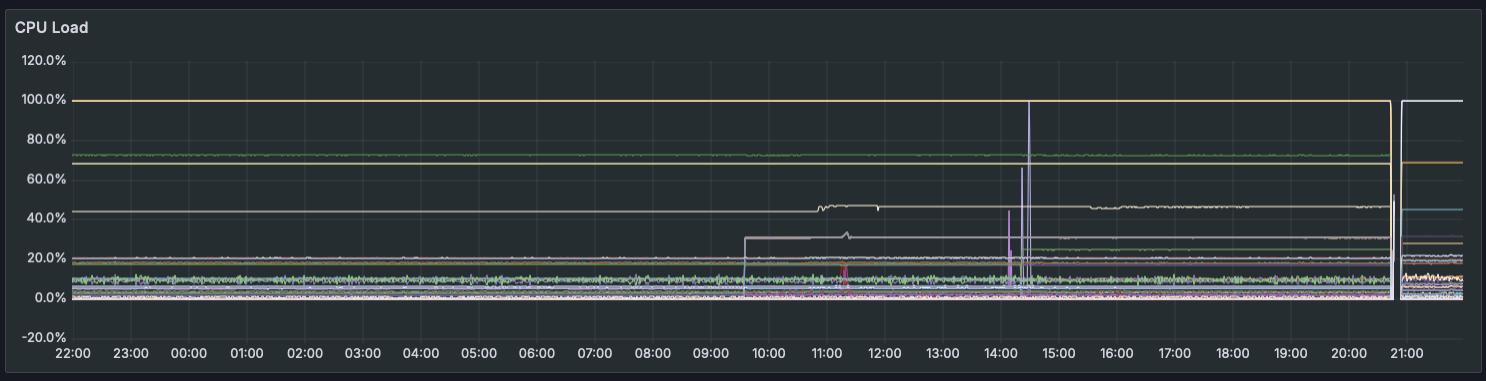
This metric shows the load on each CPU core over time. Monitoring the CPU load helps identify if the server is under heavy processing demands, which could affect application performace.
Memory Usage
Provides an overview of the server's current memory usage, including how the memory has been utilized over time. It helps track the overall memory consumption, including memory buffers, cached data, and free memory.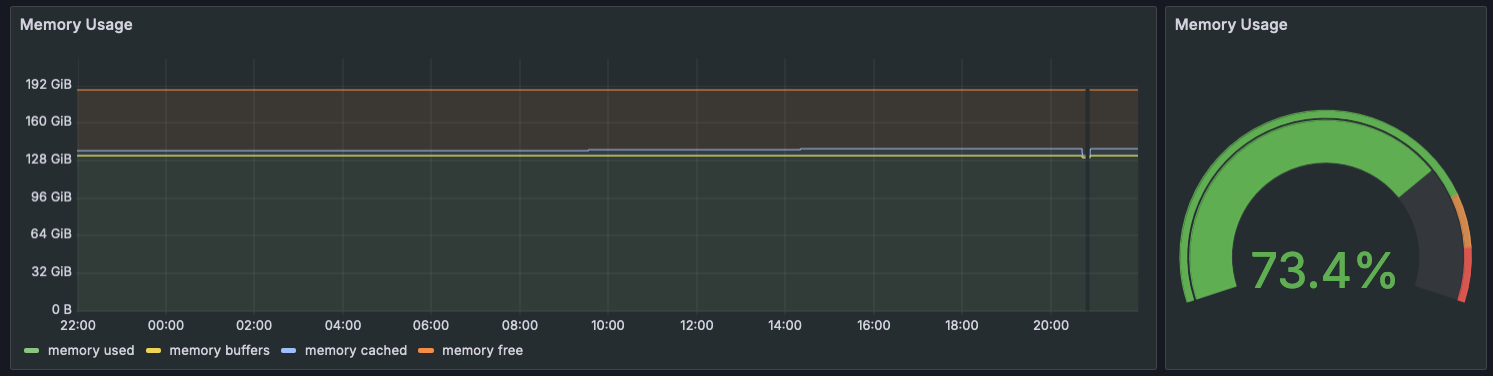
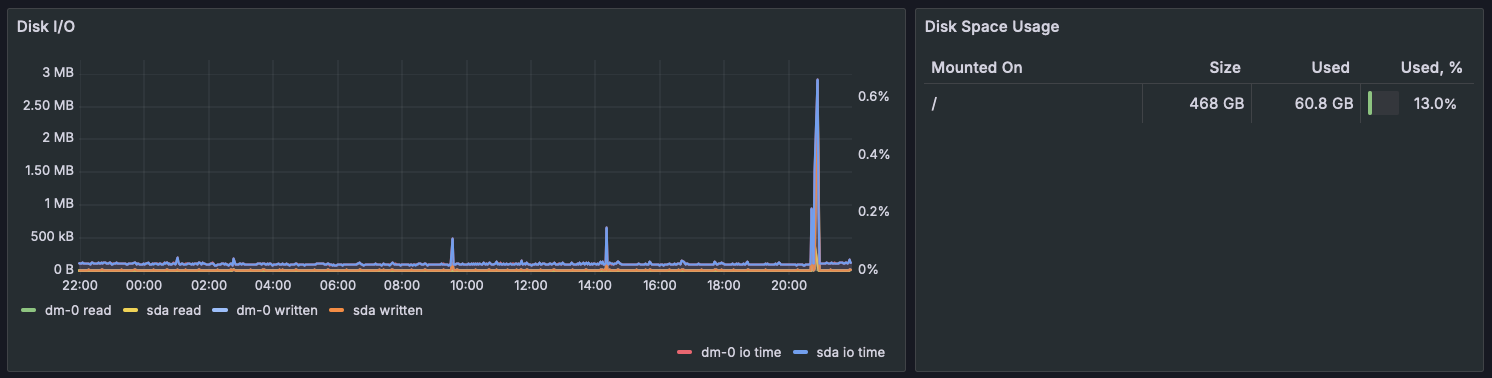
Disk Usage
Displays the current disk usage across all mount points. Monitoring disk usage is crucial, particularly for the root partition (/), as reaching 100% disk usage could cause system failures or slowdowns.
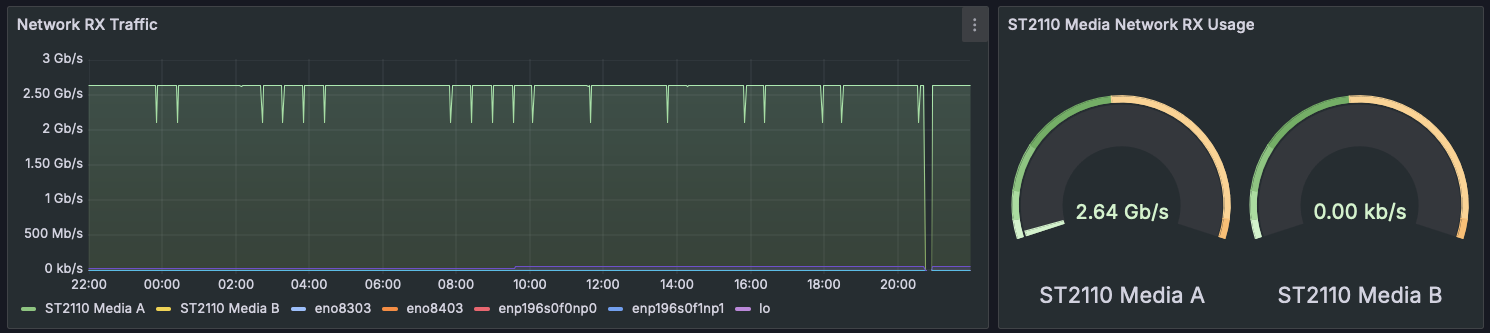
Network Traffic
Network RX Traffic - shows the incoming network traffic rate (RX) across all network interfaces.
Note that ST2110 media traffic bypasses the operating system and is reported separately (on the right of the dashboard). This provides clarity on the media data traffic compared to regular network usage.
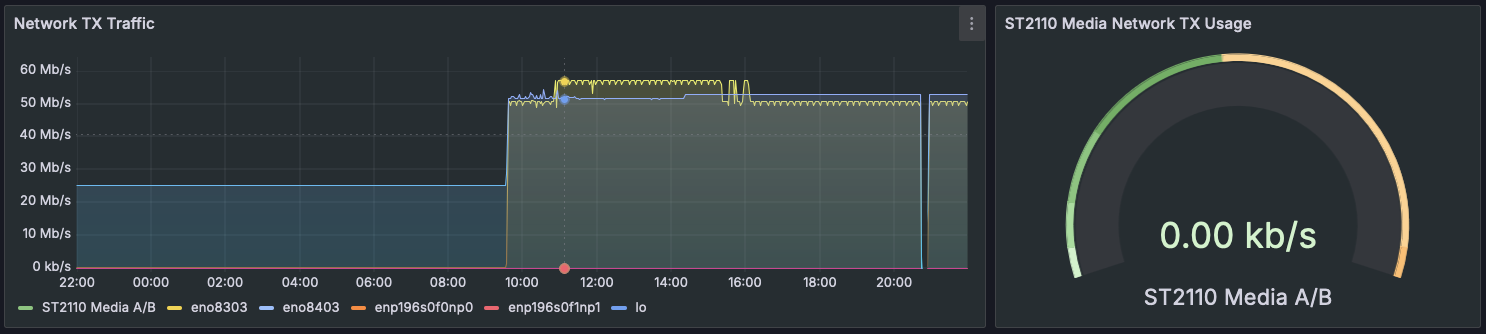
Network TX Traffic - shows the outgoing network traffic rate (TX) across all network interfaces.
Like RX traffic, ST2110 media traffic bypasses the operating system and is reported separately (on the right), helping to isolate media-related data transfers.
PTP Clock Synchronization Dashboards
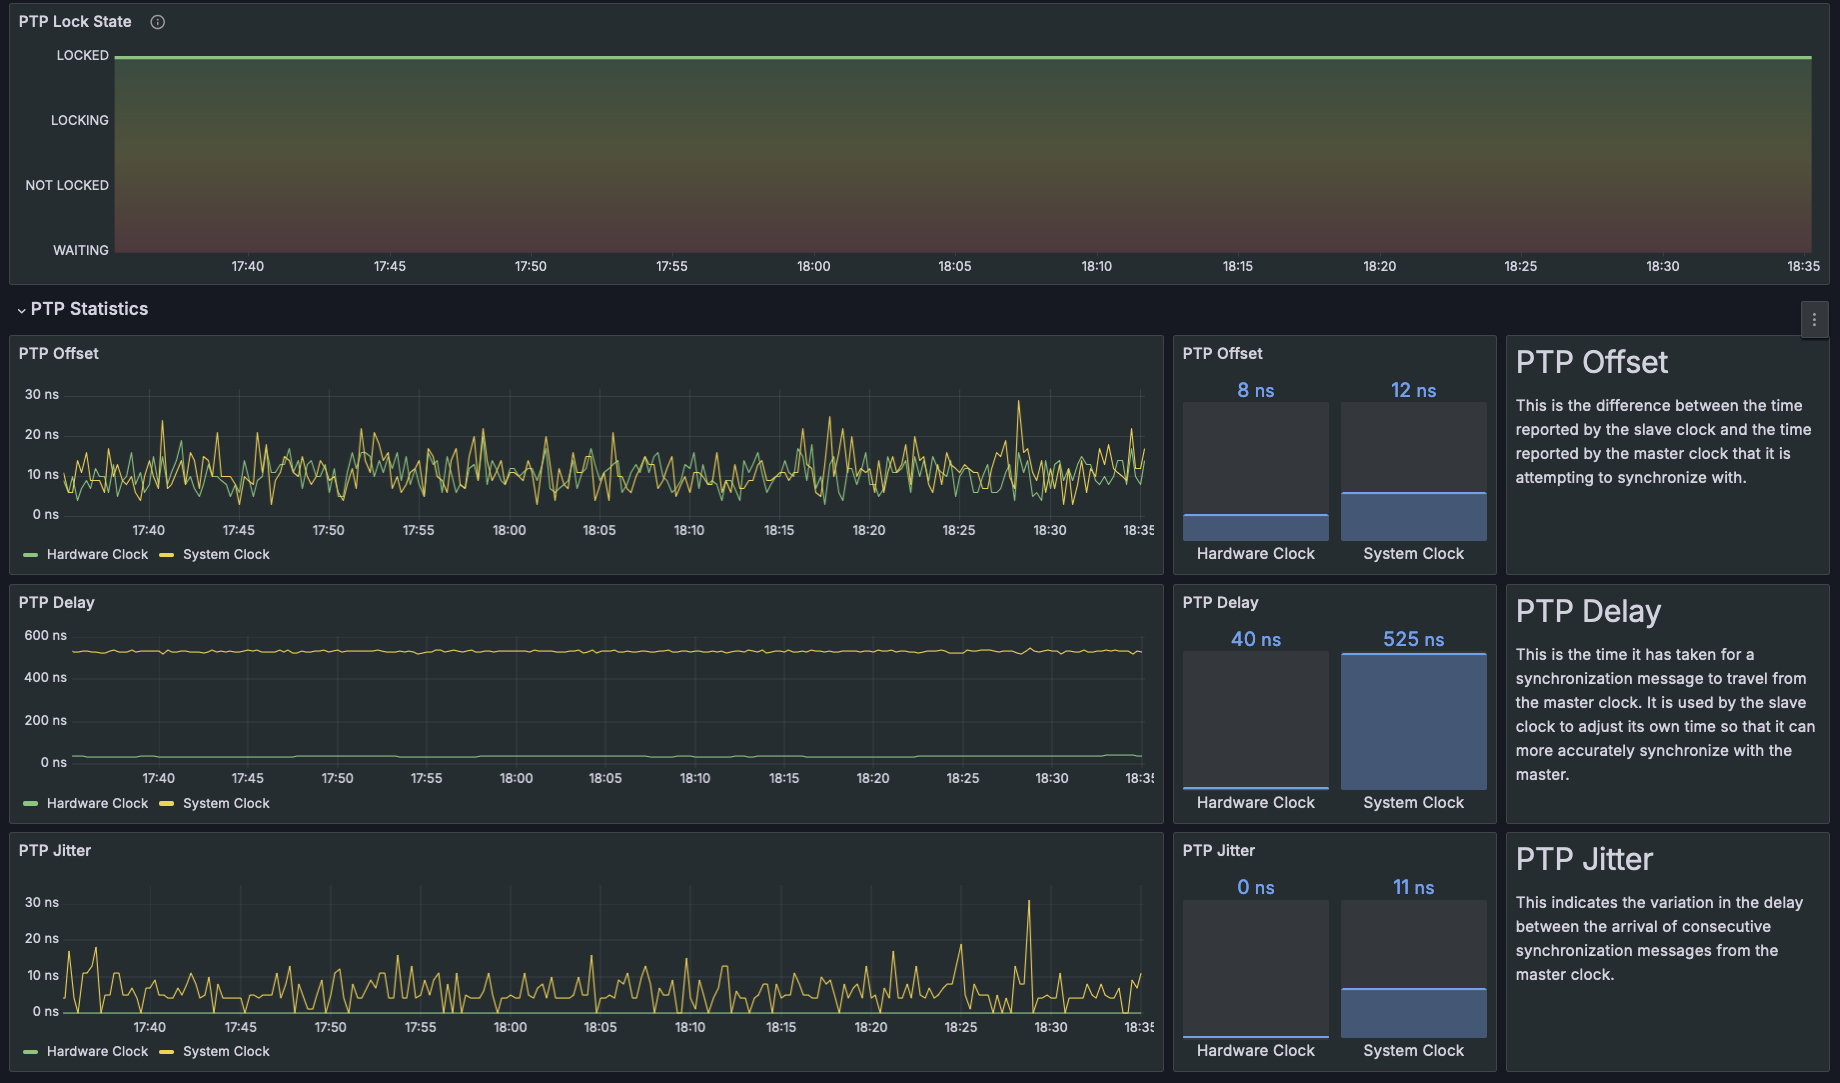
The HOME App Server PTP dashboards provide critical metrics to monitor and ensure the accurate time synchronization of the HOME Apps Servers using the Precision Time Protocol (PTP). Proper synchronization is vital for the correct operation of applications running on the server, as timing discrepancies can lead to issues in processing and communication.
This dashboard can be viewed for individual app servers. Use the App Server drop-down menu to choose which server to monitor.
Key metrics included in this dashboard are:
- PTP Offset: Difference between slave and master clock times, indicating synchronization accuracy.
- PTP Delay: Time for synchronization message to travel from master to slave.
- PTP Jitter: Variation in delay between consecutive synchronization messages.
These metrics ensure that the PTP synchronization process remains stable and accurate, which is crucial for maintaining the reliability and performance of the HOME Apps running on the server.
If you need to check or adjust the PTP configuration of an App Server, then this can be done (from the HOME UI) using the 'Advanced → PTP' menu.
HOME App Dashboards
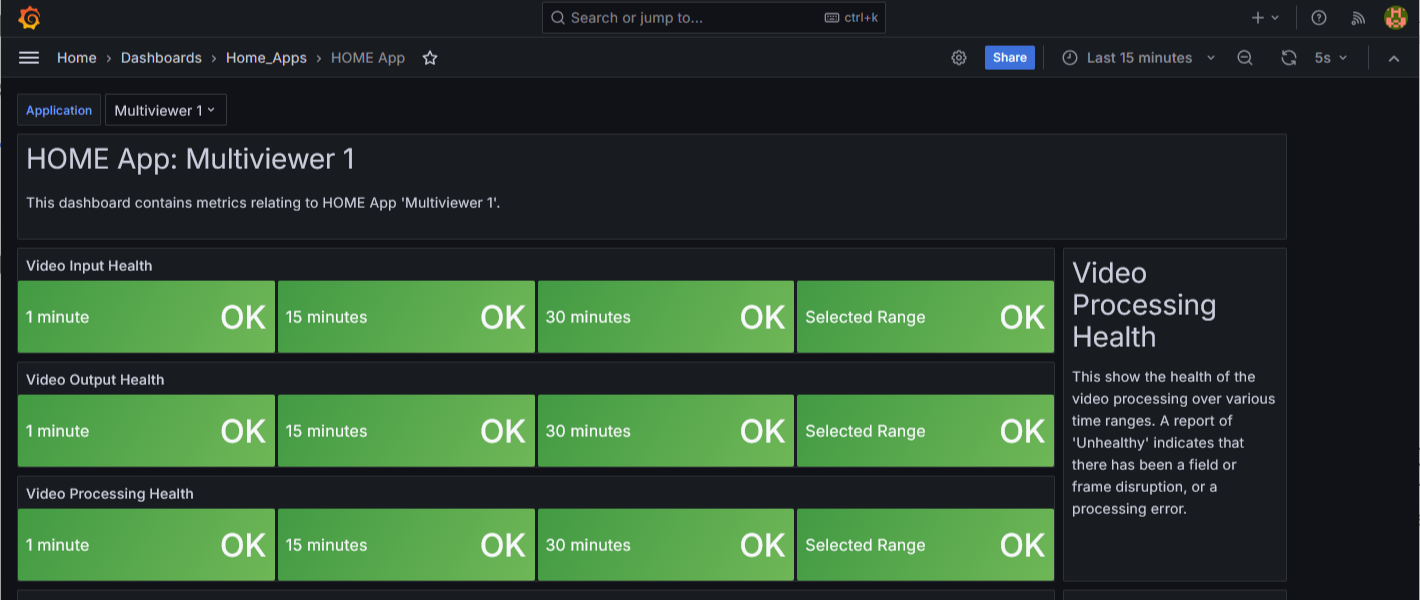
The HOME App dashboards provide information relating to an individual app.
These metrics enable a clear understanding of the app's processing health, timing events, access times and receivers/senders.
This dashboard can be viewed for individual apps. Use the Application drop-down menu to choose which app to monitor.
The example below shows part of the dashboard contents for a HOME Multiviewer.
Sender and Receiver (ST2110) Dashboards
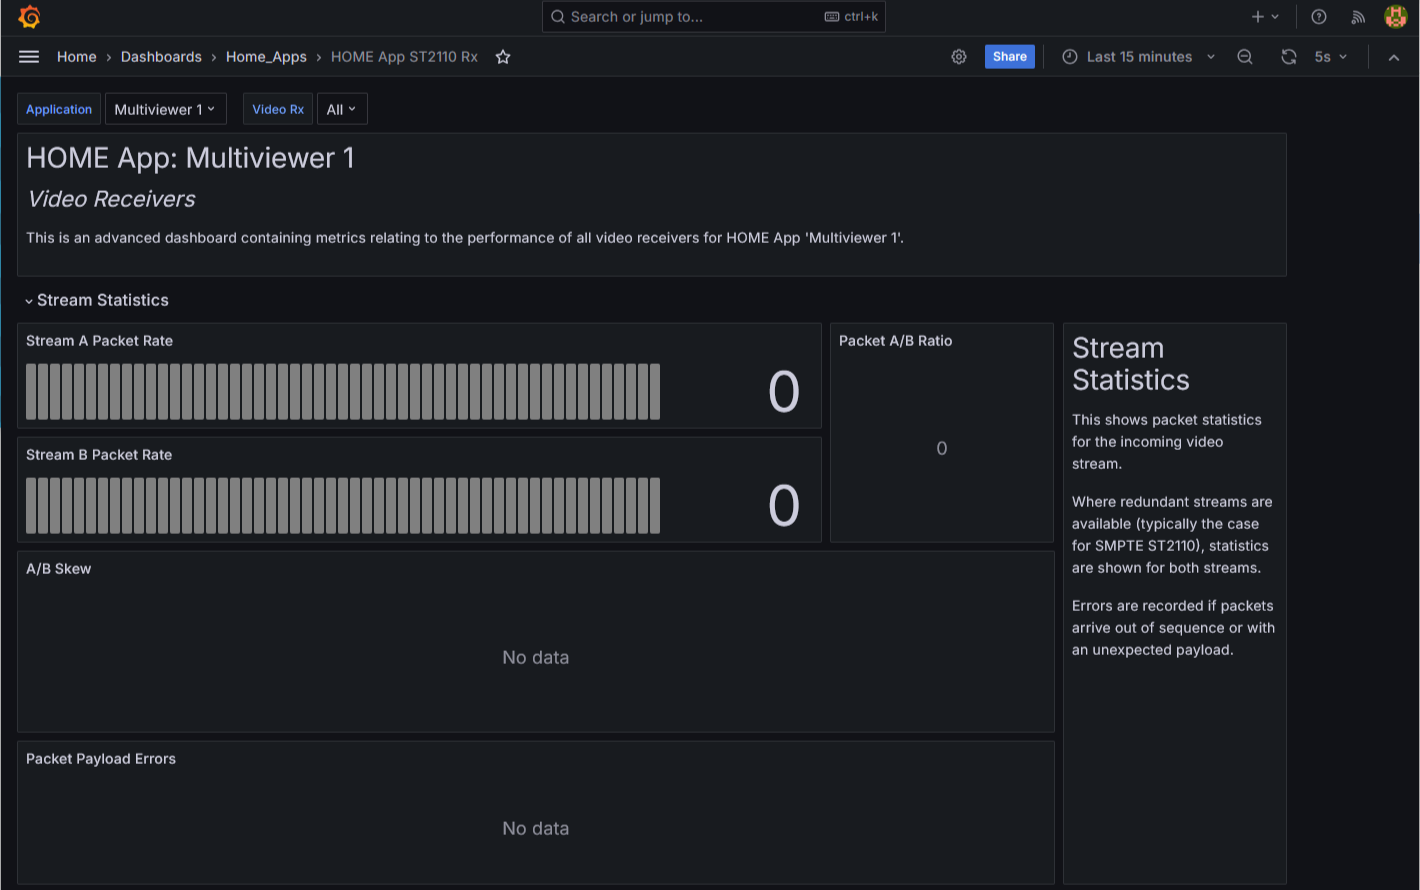
The HOME App ST2110 Rx (or Tx) dashboards provide information about the ST2110 Receivers (or Senders) for a particular app.
These metrics can be used to check sender and receiver configurations that contain stream-specific data and SDP details.
This dashboard can be viewed for individual apps and, within that app, for all or individual receivers/senders. Use the Application and Rx (or Tx) drop-down menus to choose what to monitor.
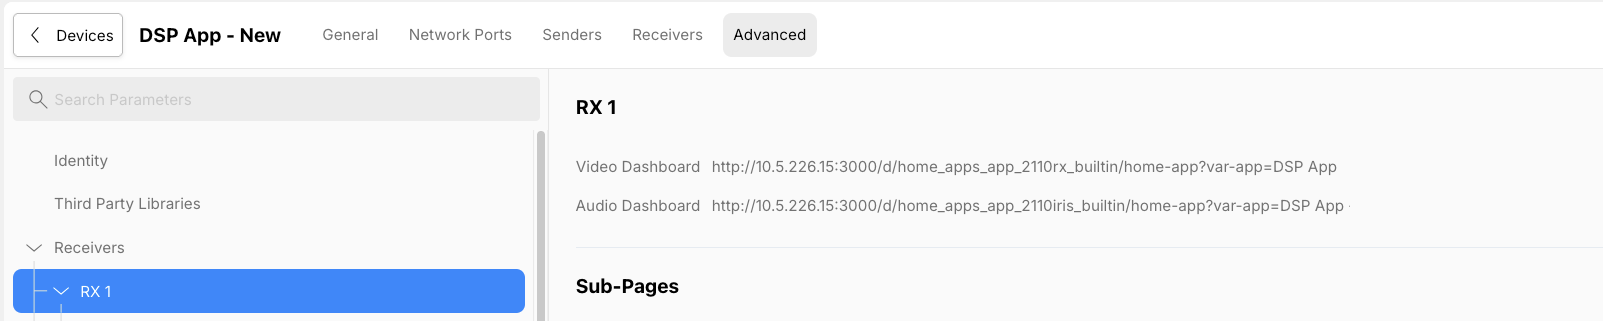
The same dashboards can be accessed (from the HOME UI) by navigating to a particular sender or receiver in the Advanced parameter tree and clicking on the 'Dashboard' shortcuts:
Once open, the dashboard shows information and statistics about the selected sender(s) or receiver(s).
Audio Receiver (ST2110 Iris) Dashboards
The HOME App ST2110 Iris dashboards are an advanced feature containing metrics relating to the performance of all SMPTE ST2110 Iris audio receivers.
While this dashboard can be viewed for any individual app, it is particularly relevant to the HOME mc2 DSP.
Measurements can be displayed for the 'red' media interface, the 'blue' media interface, or the loopback ('lb') for connections within an App Server.
Statistics can be displayed for individual stream receivers, or as combined totals across multiple receivers.
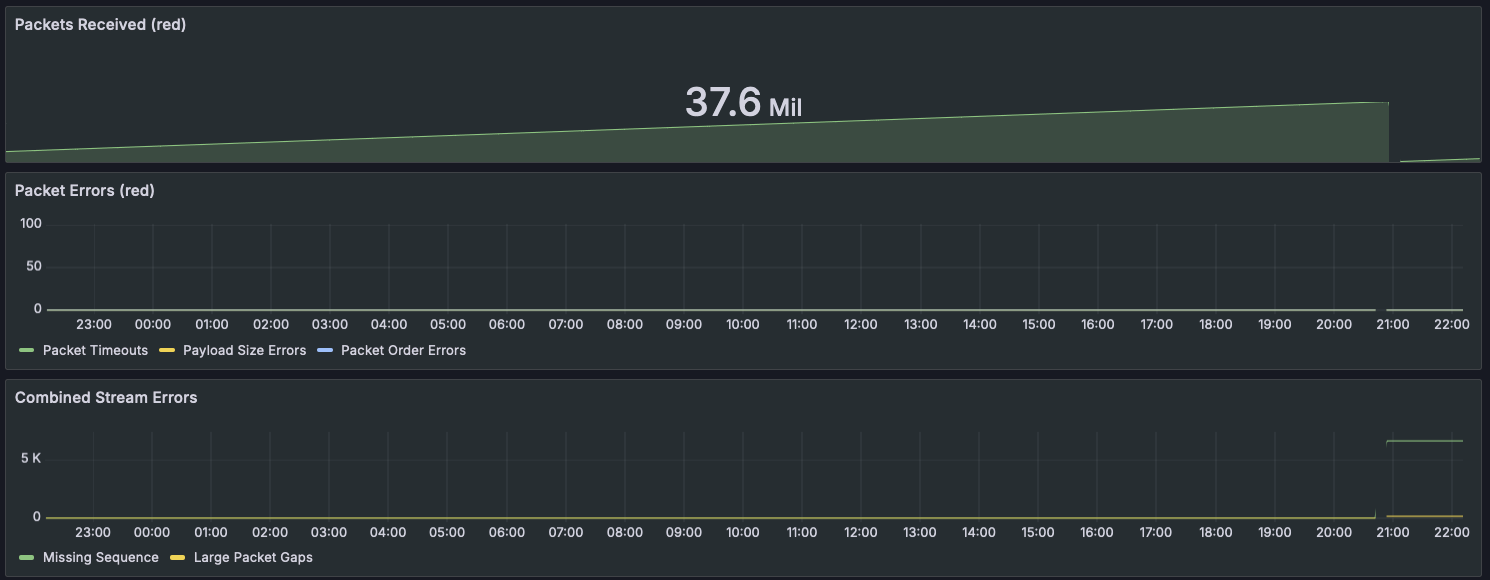
Packet Statistics & Packet Errors
Shows the total number of packets received, and any packet errors that have been detected.
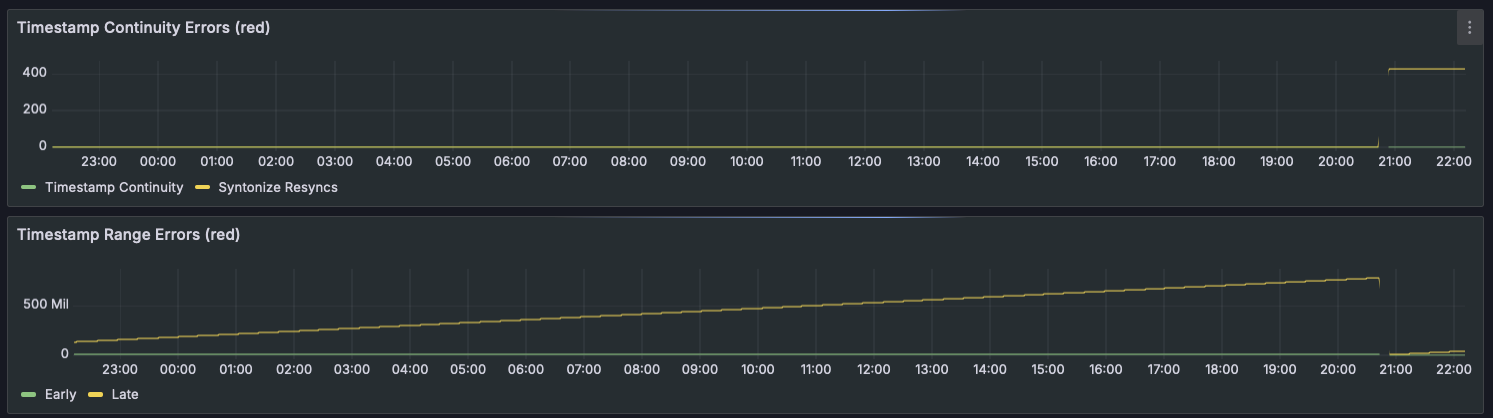
Synchronisation
Shows statistics for packet timestamp synchronisation.
Packets that are 'early' or 'late' with respect to the PTP reference clock will be discarded.
Packet Timing
Shows individual timing statistics for each stream receiver.
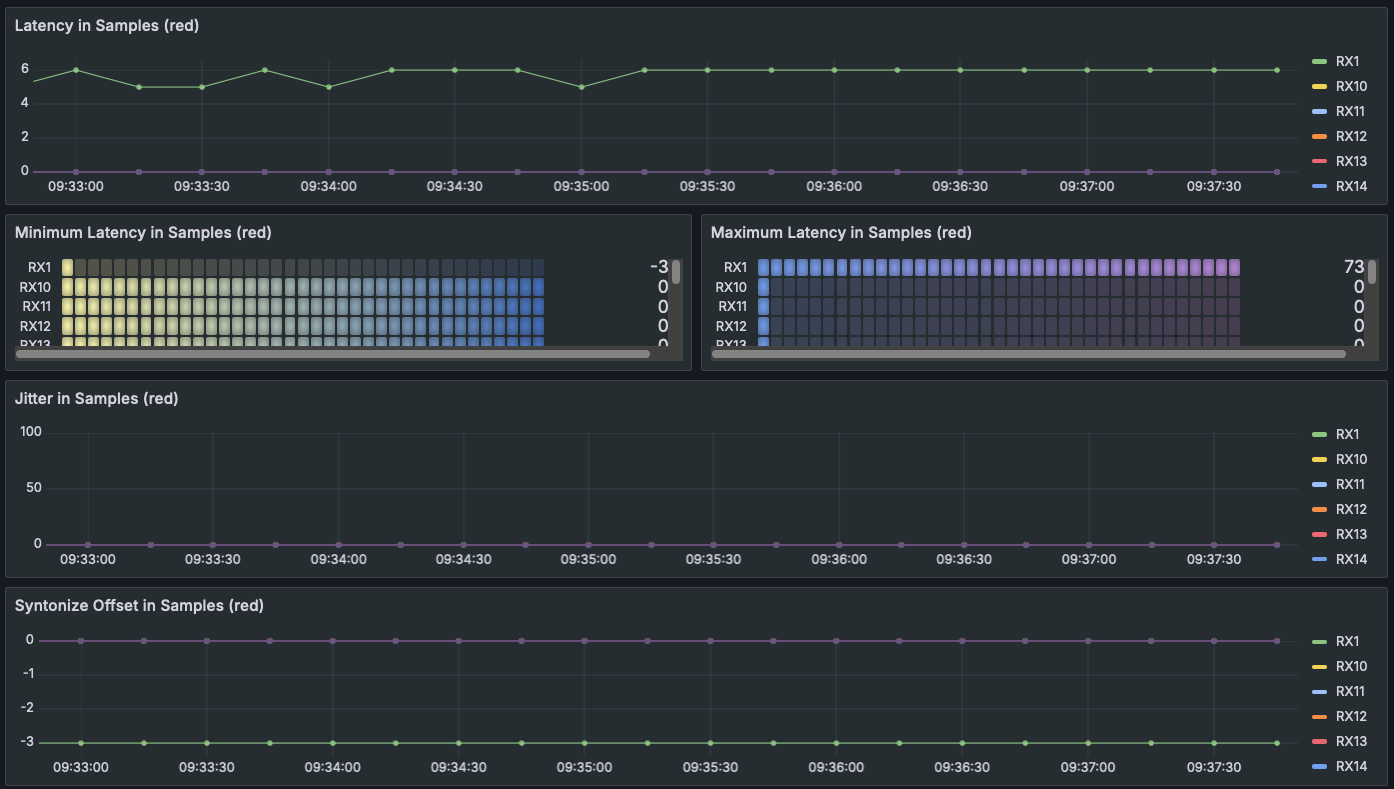
Recent Latency and Jitter measurements are shown in audio samples.
For stream receivers that are configured for Syntonize mode, the offset from the PTP reference is shown in samples.