The
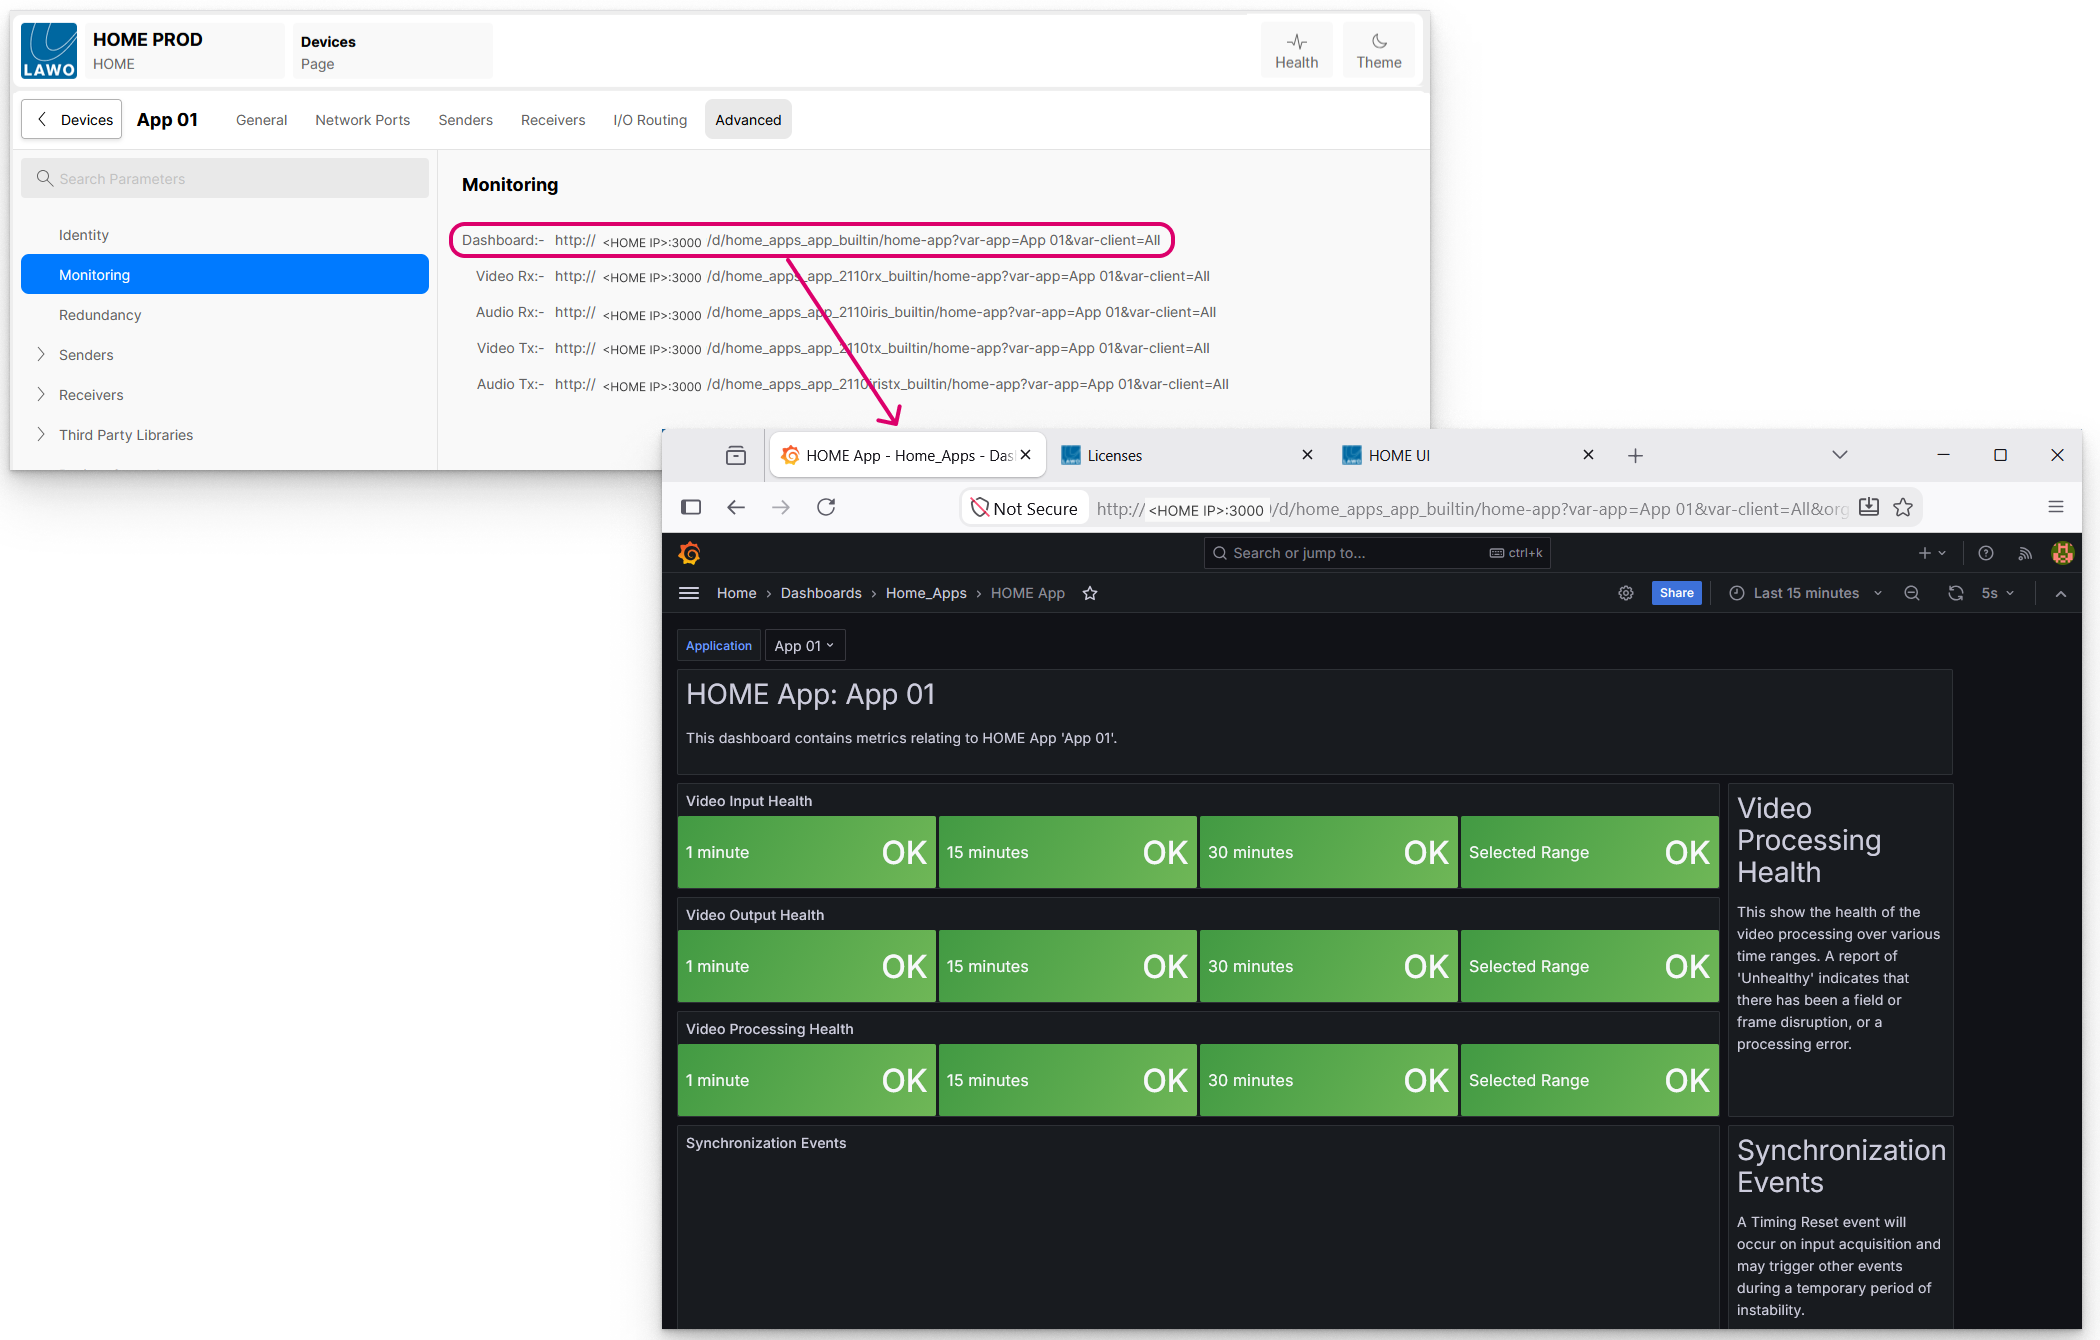
Advanced → Monitoring menu contains links to a number of predefined Grafana dashboards.
All links are provided on a single page; there are no sub-pages.
Monitoring
All apps, and app servers, provide various different metrics relating to performance. The metrics are stored in a database, and can be viewed on a graphical display via Grafana.
Each link, when clicked, redirects the web-browser to Grafana running on the HOME server(s), where the user is prompted to log in (as described here). Once logged in, Grafana opens the selected dashboard.
For an individual app, the following dashboards are provided:
- Dashboard - contains information about the application health.
- Rx or Tx - contains information about the health of the app's receivers or senders.
The example below shows the main Dashboard for a HOME UDX. The dashboards are similar for other app types.
For more information about how to open and interpret the dashboards, please see Performance Monitoring (using Grafana Dashboards).